 blog
Satellite vs Drone Crop Monitoring: Key Benefits
Table of Contents
- How Satellite and Drone Crop Monitoring Compare
- Satellite Imagery for Agriculture: Broad Coverage and Frequent Revisits
- Drone Multispectral Imaging for Crop Health: Field-Level Detail
- Satellite vs. Drone Imagery: Accuracy, Cost, and Operational Constraints
- Agricultural Drone Mapping for Water Stress, Pests, and Nutrient Issues
- Choosing the Right Method by Farm Size, Crop Type, and Use Case
- Hybrid Strategies: Combining Satellite and Drone Data
- Frequently Asked Questions
Last Updated: October 13, 2026
How Satellite and Drone Crop Monitoring Compare
Satellite and drone crop monitoring are two remote sensing methods that collect aerial data on crop health, soil moisture, and field conditions. Satellites cover entire regions in one pass; drones deliver field-level detail down to individual plants.
Most growers ask which platform is "better." That's the wrong question. These tools answer different questions at different scales, and the farms getting the most from crop monitoring use both.
Satellite imagery for agriculture has improved dramatically in recent years. Public programs like NASA's Landsat satellite missions and the European Space Agency's Sentinel constellation now provide free multispectral data at revisit rates that would have been unthinkable a decade ago.
But free data comes with trade-offs: cloud cover, spatial resolution, and revisit schedules all shape what you can see and when. Below, we break down where each method wins, where it falls short, and how to choose.
Satellite Imagery for Agriculture: Broad Coverage and Frequent Revisits
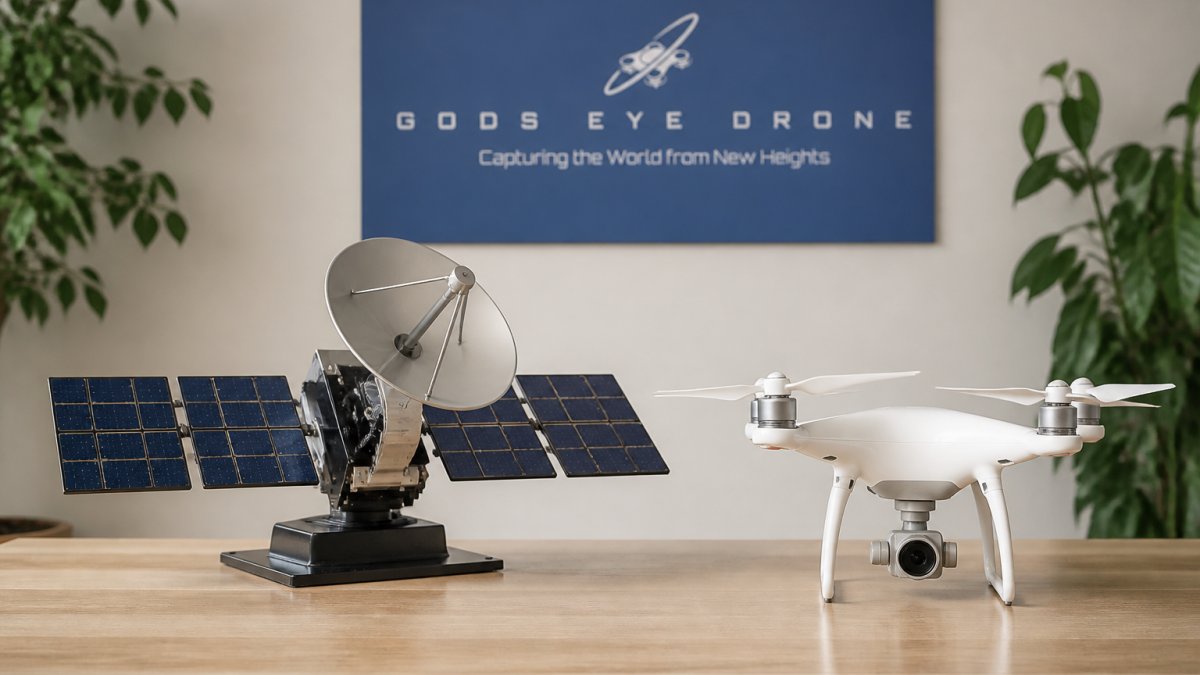
Satellite imagery for agriculture uses orbital sensors to capture multispectral data across large geographic areas. A single pass can cover thousands of acres, making it the most efficient way to monitor crop variability across a region or multi-farm operation.
The main appeal is scale. If you manage thousands of acres or multiple fields across a county, satellites give you a consistent view without sending anyone into the field, with predictable revisit schedules and data that's easy to compare over time.
How Often Satellites Capture Field Data
Revisit frequency varies by program. Some constellations capture the same location every few days; others take over a week. For fast-moving problems like pest outbreaks or water stress, that gap matters, a field that looks fine Monday can show serious stress by Thursday.
Limitations of Satellite Crop Monitoring
Satellite crop monitoring struggles with three things: cloud cover, resolution, and timing. Heavy clouds block the view entirely, which in humid regions can mean weeks of lost data. Most free satellite data resolves at 10 meters per pixel, so a small disease patch in one corner of a field may never show up.
Drone Multispectral Imaging for Crop Health: Field-Level Detail
Drone multispectral imaging for crop health captures centimeter-level imagery, revealing problems satellite data cannot see. A drone flying at 120 meters can resolve individual plants, changing what's possible for field scouting and targeted treatment.
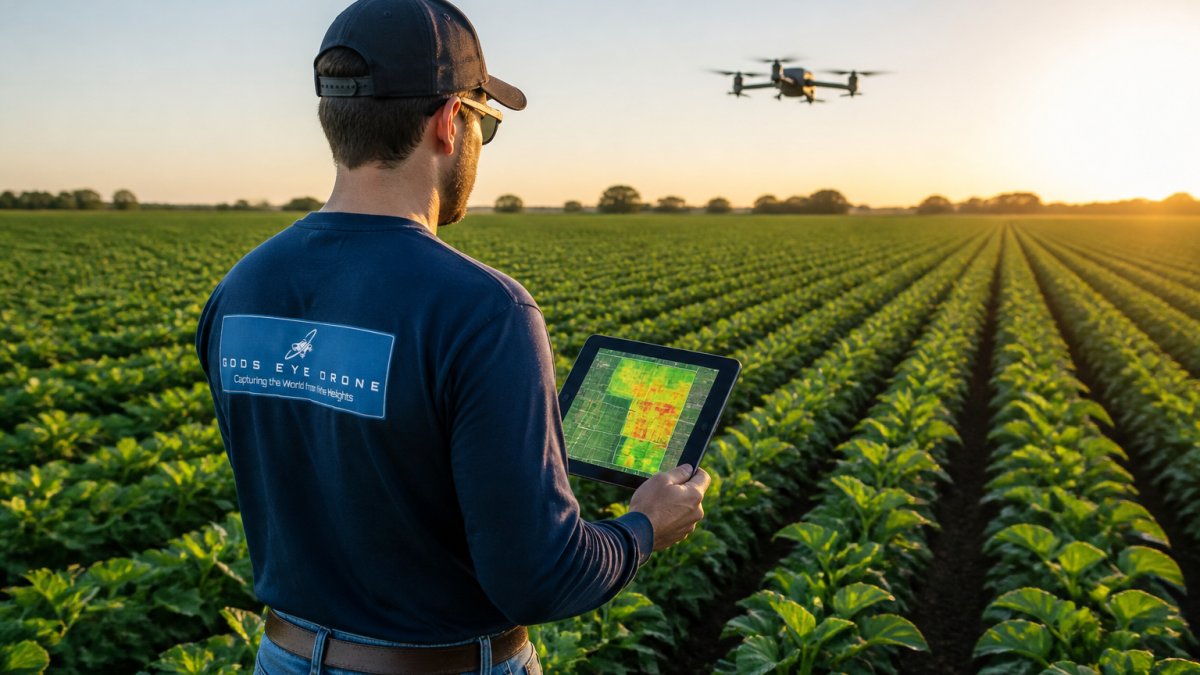
The trade-off is coverage: a single drone flight covers tens to hundreds of acres, not thousands. Large operations must prioritize which fields to fly and when.
Vegetation Indices and What They Reveal
Vegetation indices are formulas that combine specific light wavelengths to measure plant health. The most common, NDVI, compares near-infrared and red light to estimate chlorophyll content and biomass: higher values mean healthy, dense vegetation; lower values flag stress, bare soil, or disease.
Other indices tell you different things. NDRE is more sensitive to nutrient deficiencies. NDWI highlights water content, useful for irrigation management. The USGS remote sensing guide explains how these indices are calculated and what each one is best at detecting.
Satellite vs. Drone Imagery: Accuracy, Cost, and Operational Constraints
The satellite vs. drone imagery debate comes down to three factors: accuracy, cost, and operational constraints. Neither platform wins across the board; each excels in specific conditions.
| Factor | Satellite | Drone |
|---|---|---|
| Coverage per pass | Thousands of acres | Tens to hundreds of acres |
| Spatial resolution | 10 meters per pixel (free data); 30-50 centimeters per pixel (commercial) | 1-5 centimeters per pixel |
| Revisit frequency | Every few days (weather permitting) | On-demand |
| Cloud cover impact | Blocks data entirely | Fly below the clouds |
| Cost structure | Low per-acre, subscription-based | Per-flight or per-project, plus capital and labor |
| Best for | Large-scale monitoring, regional trends | Field-level detail, targeted scouting |
Total Cost of Ownership, Not Sticker Price
Most comparisons stop at the subscription or per-flight price, missing the real cost structure. A satellite subscription is largely a per-acre data cost with almost no labor. A drone program carries capital cost (airframe, multispectral and thermal payloads, spare batteries), maintenance, pilot training and certification, insurance, and labor for flight planning, execution, and image processing.
Drone programs look expensive in year one because capital sits up front, then per-acre cost falls as the same equipment covers more flights and acres across seasons. Satellite inverts that: low entry cost, but you keep paying per acre for as long as you want data.
The cost rarely counted is avoided crop loss. A missed disease patch or an irrigation problem caught a week late can cost far more than either monitoring method. That avoided-loss figure, not the data price, should drive the decision.
Calibration, Accuracy, and Ground-Truth Validation
Accuracy is not a property of the platform but of the whole pipeline: sensor, calibration, processing, and field verification.
Satellite sensors are calibrated against reference targets and processed to consistent surface-reflectance products, making imagery comparable across dates and locations, a real advantage for tracking trends over a season.
Drone sensors are not automatically comparable; reflectance values drift with sensor age, light conditions, and flight altitude. A reflectance calibration panel shot before each mission, consistent flight altitude and time of day, and a fixed processing workflow keep vegetation index values meaningful across flights.
Ground-truth validation matters for both. Remote sensing tells you where to look, not always what you're seeing; walking the field and confirming what the imagery shows turns a colorful map into a decision. A common mistake is treating vegetation indices as a diagnosis rather than a signal.
Cloud Cover, Revisit Schedules, and Operational Constraints
Cloud cover is the biggest operational constraint for satellite monitoring. In frequently overcast regions, satellite data can go missing for days or weeks. Drones fly below the cloud layer, working in conditions that ground satellite programs entirely.
Revisit schedule is the second constraint. Satellite intervals are fixed by orbit, so you can't choose when the next usable image arrives. Drone flights are on-demand, letting you respond the day you notice a problem, subject to wind limits, battery life, and field access.
Flight permissions and airspace are the drone-side constraint satellite doesn't have. Commercial operations fall under FAA rules, including Part 107 certification and, in controlled airspace, prior authorization. That adds planning time and can delay a mission. Battery life also caps acres per flight, so large fields often need multiple missions and battery swaps.
Agricultural Drone Mapping for Water Stress, Pests, and Nutrient Issues
Agricultural drone mapping uses drone-mounted sensors to create detailed maps of field conditions, including water stress, pest outbreaks, disease, and nutrient deficiencies. Because drone imagery resolves individual plants, it catches problems while they're still small enough for targeted spraying or variable-rate application.
Water stress shows up first as a change in leaf temperature and reflectance. Thermal sensors pick this up before visible wilting, giving a head start on irrigation management. Pest outbreaks often appear as clustered patches of stress, which drone maps isolate to specific rows rather than treating an entire field.
Nutrient deficiencies follow patterns too: nitrogen shortages show up in older leaves first, while other deficiencies have their own signatures. A drone map can guide variable-rate application, so you fertilize only where needed, cutting input costs and reducing runoff.
Choosing the Right Method by Farm Size, Crop Type, and Use Case
The right choice depends on three variables: farm size, crop type, and what you're trying to accomplish. There's no universal answer, but a decision matrix based on those variables covers most situations.
A Practical Decision Matrix
| Situation | Recommended method | Why |
|---|---|---|
| Small farms under 500 acres | Drone mapping | Field-level detail at a cost that makes sense for the acreage; on-demand flights when problems appear |
| Large operations over 5,000 acres | Satellite first, drone for flagged zones | Satellite screens the whole operation cheaply; drones diagnose the fields that need attention |
| Row crops with uniform management | Satellite | Broad, consistent data is often sufficient for tracking overall crop health and yield estimation |
| High-value specialty crops | Drone multispectral and thermal | The cost of a missed problem is high, and the detail level supports targeted intervention |
| Irrigation scheduling | Thermal drone imagery | Leaf-temperature data gives the most actionable signal on water stress, especially with variable soil types |
| Mid-size operations (500-5,000 acres) | Hybrid | Satellite for the wide view, drone for the fields where the satellite flags stress |
Crop Type Changes the Answer
Crop type matters as much as acreage. Row crops in uniform blocks suit satellite screening because a single pixel covers many plants and the field is managed as a unit. Specialty crops, orchards, and vineyards are the opposite: individual trees and vines are the management unit, and a 10-meter pixel blends several plants, so drone imagery is usually the only way to see a problem on a single tree.
Canopy structure also affects how well vegetation indices work. Dense, uniform canopies produce cleaner values; sparse or row-planted crops expose soil between rows, mixing soil reflectance into the index and making satellite values harder to interpret. Centimeter-resolution drone imagery separates canopy from soil, which is why it holds up better in those fields.
Workflow Integration and Actionable Alerts
Imagery only pays off when it becomes a task. The workflow: imagery produces a vegetation index map, the map is compared against a threshold or previous flight, and anything outside that threshold generates an alert routed to the person who scouts, sprays, or irrigates.
Most farm-management systems accept prescription maps and scouting layers, so imagery can feed directly into variable-rate application or a scouting task list. The failure mode is data that sits in a dashboard and never reaches the field. Set thresholds, decide who receives alerts, and confirm your equipment can read the imagery format before committing to a monitoring program.
Hybrid Strategies: Combining Satellite and Drone Data
The most effective crop monitoring programs use satellite and drone data together. Satellites flag which fields need attention; drones deliver the detail to act on those flags.
It also solves the cost problem. Satellite data is cheap or free at scale; drone flights cost more per acre but cover less ground.
Workflow integration is where most operations fall short. Data that sits in a dashboard and never reaches the person making spraying or irrigation decisions is wasted.
Our certified pilots fly multispectral missions for farms across the region, and we help clients connect that data to decisions they're already making, from a single field flight to an ongoing monitoring program.
Crop monitoring only pays off when the data reaches the people making decisions in the field.
Frequently Asked Questions
Is satellite or drone imagery better for monitoring crop health?
Neither is universally better. Satellite imagery covers large areas quickly and works well for regional crop variability and yield estimation. Drone imagery delivers field-level detail down to individual plants, making it better for detecting early water stress, pest outbreaks, or nutrient deficiencies in specific zones. Many farms use satellite for broad monitoring and drones for targeted scouting.
How often can satellites and drones monitor a field?
Satellites typically revisit the same field every few days, though cloud cover can delay usable imagery. Drones fly on demand, so you can capture data whenever conditions allow, even multiple times per week during critical growth stages. This makes drone monitoring more flexible for timely decisions on irrigation, spraying, or fertilizer use.
What are the limitations of satellite crop monitoring?
Satellite imagery is limited by spatial resolution, cloud cover, and fixed revisit schedules. Small fields or narrow crop rows may be hard to assess, and you cannot request a flyover during a pest outbreak. Data accuracy also depends on calibration and ground-truth validation, which satellite providers handle remotely rather than on your farm.
What kind of detail can drone crop imagery provide?
Drones with multispectral sensors can capture imagery at spatial resolutions fine enough to distinguish individual plants. This supports vegetation indices like NDVI, helping identify crop variability, disease detection, and water stress before symptoms are visible to the naked eye. The result is more precise prescription maps for variable-rate application of inputs.