 how-to
Drone Surveying for Irrigation Management: 7 Steps
Table of Contents
- Drone Surveying for Irrigation Management: A 7-Step Workflow
- Step 1: Define the Question Before You Fly
- Step 2: Choose Sensors for Multispectral Drone Crop Water Stress Detection
- Step 3: Lock Flight Parameters for Repeatable Coverage
- Step 4: Thermal Drone Imaging for Irrigation Problem Detection
- Step 5: Drone Mapping for Irrigation Zones and Terrain Planning
- Step 6: Ground-Truth Before You Act on Any Map
- Step 7: Turn Survey Data Into Irrigation Scheduling Actions
- Frequently Asked Questions
Last Updated: October 12, 2026
Drone Surveying for Irrigation Management: A 7-Step Workflow
Drone surveying for irrigation management is the practice of using unmanned aerial vehicles to map soil moisture, crop water stress, and terrain so growers can water the right zones at the right time. Water is the most expensive input on most irrigated fields, and most growers still schedule it by habit rather than by data. Below, we break down the exact 7-step workflow we use, from defining the question to turning maps into irrigation scheduling actions. Each step builds on the last, so skipping one weakens the rest.
Step 1: Define the Question Before You Fly
A drone flight without a clear question produces pretty pictures and nothing else. Decide what you need to know first: Is a zone drying out faster than the rest? Is a pump underperforming? Are you planning a new irrigation layout?
Write your question down. Then pick the field, the timing, and the deliverable that answers it. A grower chasing a suspected leak needs a thermal flight this week. A grower planning next season's zones needs elevation data and a full field map.
This one habit separates useful surveys from wasted flights. It also tells you which sensors to bring, which we cover next.
Step 2: Choose Sensors for Multispectral Drone Crop Water Stress Detection
Multispectral drone crop water stress detection works by measuring light reflected from plants in bands the human eye cannot see. Stressed plants reflect differently in near-infrared and red-edge bands, so the imagery reveals problems before they show up visually. The key is matching the sensor to the irrigation question you are actually asking, because each payload measures something different and each has hard limits.
Match the Sensor to the Irrigation Question
| Irrigation question | Best sensor | What it measures | What it cannot tell you |
|---|---|---|---|
| Where is the crop stressed? | Multispectral | Reflectance in visible, red-edge, and near-infrared bands | The cause of stress (water, disease, or nutrient) |
| Where is water not reaching? | Thermal | Canopy surface temperature | Whether the soil is dry or the plant is simply hot |
| What is planted and where? | RGB | Visible color and structure | Anything about plant water status |
| Where does water pool or run? | RGB plus elevation (photogrammetry or LiDAR) | Surface topography and slope | Subsurface drainage or soil texture |
The Vegetation Indices That Actually Matter
Most multispectral irrigation work relies on a small set of indices. NDVI (normalized difference vegetation index) uses red and near-infrared bands and is the most widely used, but it saturates in dense canopies and responds to nitrogen and disease as much as water. NDRE (normalized difference red-edge) uses the red-edge band and holds up better in mature, closed canopies, which makes it more useful for mid-season water stress.
A practical pattern: fly NDVI early in the season for establishment and variability, switch to NDRE once the canopy closes, and use thermal or CWSI when you specifically need to find dry zones and emitter problems.
Sensor Limits That Change Your Conclusions
No sensor measures soil moisture directly from the air. Vegetation indices and thermal readings are indirect signals of plant condition, not a moisture reading in inches.
Thermal has its own constraints.
Multispectral has a resolution trade-off. Higher altitude covers more ground per flight but coarsens ground sample distance, so small features like a single clogged emitter may disappear.
A common mistake is treating one multispectral flight as ground truth. It is not. It is a map of where to look, and step 6 exists because of that limit.
Step 3: Lock Flight Parameters for Repeatable Coverage
Repeatable coverage comes from fixed flight parameters, not from flying by feel. If you want to compare this week's map to last month's, every variable has to match.
Lock these before takeoff:
- Altitude and ground sample distance
- Overlap and sidelap percentages
- Flight direction and grid pattern
- Time of day and sun angle
- Camera settings and white balance
Fly the same field at the same altitude and time of day each visit. Battery endurance and wind limits will shape your plan, so build in margin. A mission that runs out of battery mid-field leaves a gap you cannot compare later.
Consistency beats perfection here. A slightly imperfect map you can repeat tells you more than a perfect one you cannot.
Step 4: Thermal Drone Imaging for Irrigation Problem Detection
Thermal drone imaging for irrigation problem detection finds the spots where water is not reaching the crop. Dry soil and water-stressed plants run warmer than well-watered ones, so they show up as hot patches in the thermal view.
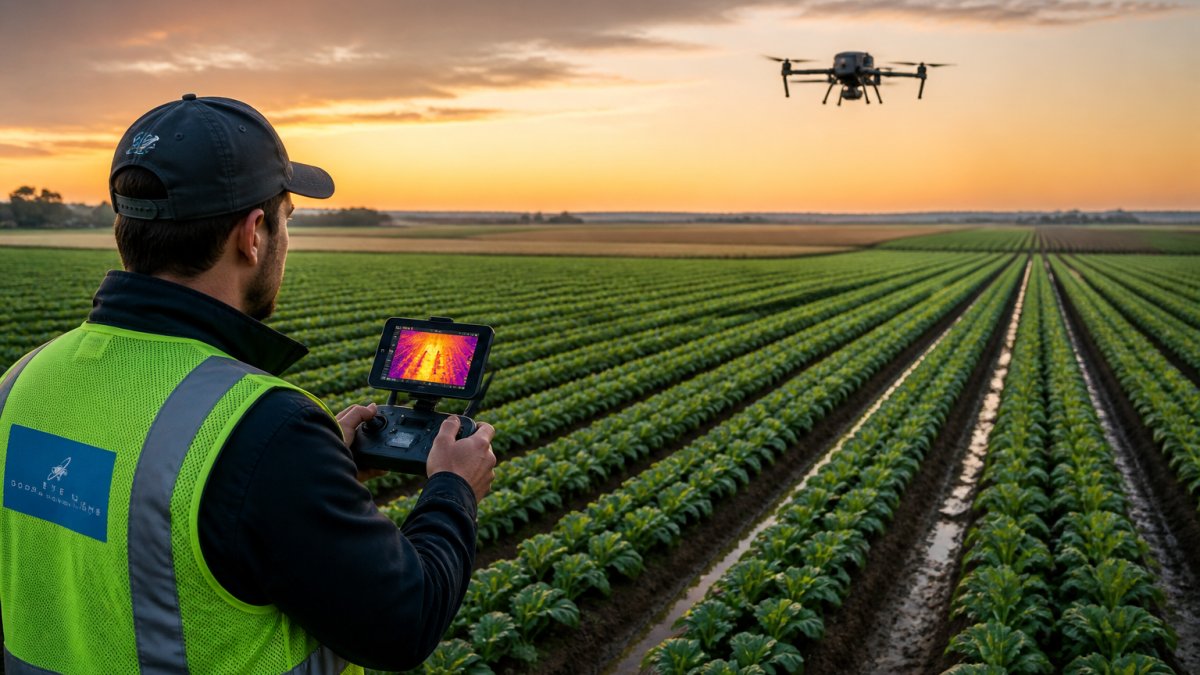
Fly thermal missions early morning for the cleanest contrast. Midday heat blurs the differences you are hunting for.
Watch for these patterns:
- Hot streaks along a row: often a clogged emitter or broken line.
- Hot patches at field edges: usually poor coverage or low pressure.
- Uniformly warm blocks: a zone getting too little water overall.
Thermal imagery points you to the problem area. It does not tell you the cause. That is a job for a walk in the field, which is exactly what step 6 covers.
Step 5: Drone Mapping for Irrigation Zones and Terrain Planning
Drone mapping for irrigation zones and terrain planning turns raw images into a working map of your field. Software stitches the photos into an orthomosaic, a single flat image of the whole field, and builds elevation and terrain models from the same flight.
Those elevation models matter more than most growers expect. Water runs downhill, so slope and low spots decide where it pools and where it starves. Mapping terrain shows you:
- Natural drainage paths across the field
- Low spots that stay wet too long
- High spots that dry out first
- Where irrigation zones should actually break
From there, you can draw irrigation zones that match how water really moves, not how the field looked on a plat map. Spatial mapping also supports canal alignment and irrigation layout planning for new systems.
The output is a set of zones with different water needs. That sets up the scheduling decisions in step 7.
Step 6: Ground-Truth Before You Act on Any Map
Ground-truthing is the step most guides skip, and it is the one that keeps you from wasting water and money. A map shows a pattern.
Walk the hot spots and stressed zones your survey flagged. Check soil moisture by hand or with a probe. Look at emitters, valves, and pressure.
If the map and the ground disagree, trust the ground. Then ask why the map was off: wrong flight time, recent rain, or a sensor limit from step 2.
This accuracy check does two things. It confirms the real problem, and it teaches you how to read your own maps better next time.
Step 7: Turn Survey Data Into Irrigation Scheduling Actions
Survey data only pays off when it changes what you do. The gap between a map and a result is a decision rule: for each pattern the survey shows, what action do you take, when, and how do you confirm it worked? Below is the decision layer we use, organized by finding.
Decision Rules by Finding
| Finding | Likely cause | Action | Timing | Follow-up |
|---|---|---|---|---|
| Hot streak along a row | Clogged emitter or line break | Inspect and repair that line | Within the week | Re-fly in 7-10 days |
| Warm block in one zone | Zone getting too little water | Adjust that zone's schedule or run time | Next irrigation cycle | Check soil moisture in 3 days |
| Low spot staying wet | Poor drainage or overwatering | Cut water to that zone | Next cycle | Watch for root issues and disease |
| Edge patch running dry | Low pressure at the far end | Rebalance pressure or split the zone | Before next season if possible | Re-check after next cycle |
| Uniformly stressed block | Whole zone underwatered or crop-stage change | Recalculate crop water use for that stage | Same week | Re-fly after one full cycle |
Set Thresholds, Not Just Patterns
A pattern only triggers action when it crosses a threshold you define in advance. Two practical rules most growers can apply:
- Zone variability rule: if one zone's index value differs from the field average by more than roughly 10-15 percent on a consistent basis, treat that zone as a separate scheduling unit rather than averaging it into the whole field.
- Persistence rule: act on a pattern only after it appears in two consecutive flights. A single hot patch can be a shadow, a cloud edge, or a sensor artifact. A pattern that repeats is real.
Tie Actions to Crop Stage
Water demand changes with growth stage, so the same map reading means different things in June and August. Early season, variability usually reflects emergence and soil differences. Mid-season, it reflects canopy water status and irrigation uniformity. Late season, it reflects senescence, and stress signals become less reliable. Adjust your interpretation and your re-survey cadence to the stage, not just the calendar.
Close the Loop
Run the cycle: survey, verify on the ground, act, re-survey. The re-survey is what tells you whether the change worked. If a repaired line still shows hot after 7-10 days, the problem was not the line. If a schedule adjustment flattens the zone variability, the change paid off. Over a season, the maps become a record of what your irrigation decisions actually did, which is the input for next season's zone layout and scheduling.
For growers who want this handled end to end, Gods Eye Drone runs the full workflow with certified pilots and advanced FLIR equipment, from flight planning through the final zone map.
Frequently Asked Questions
How can drone surveying help with irrigation management?
Drone surveying gives you a field-wide view of water status that walking and spot checks miss. Multispectral and thermal sensors reveal variability in crop water stress, soil moisture patterns, and irrigation problems across irrigated fields, orchards, and row crops. The output is not just imagery: orthomosaics, vegetation indices, and elevation data feed an irrigation plan that targets problem zones instead of watering the whole field evenly. That supports water-use efficiency and water conservation while keeping crop health stable.
What drone sensors are used to monitor crop water stress?
Multispectral sensors are the standard for crop water stress because they capture bands that feed vegetation indices sensitive to canopy water status. Thermal sensors add canopy temperature, which rises when a plant closes its stomata under water stress. RGB sensors support field mapping and crop identification but do not measure water stress directly. Many agricultural drone payloads combine multispectral and thermal imaging, and some add lidar for elevation and terrain data. Sensor selection should follow the question you need answered.
Can thermal drone imaging for irrigation detect leaks or dry areas?
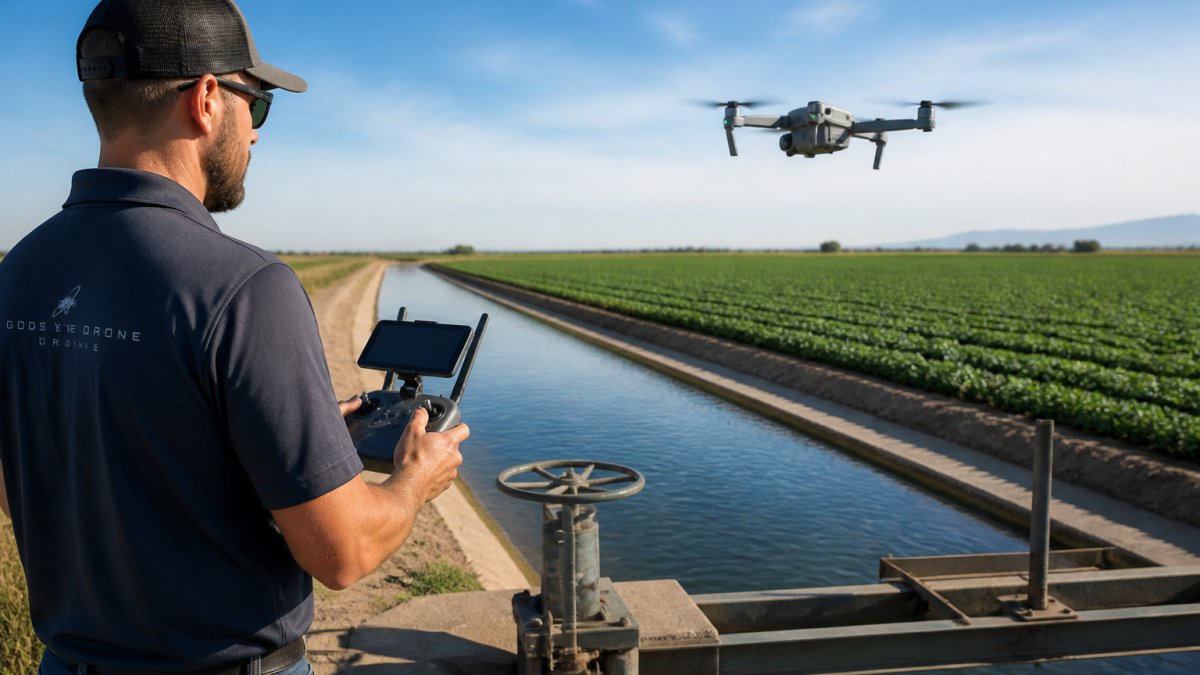
Thermal drone imaging for irrigation can show temperature differences that often correspond to leaking lines, clogged emitters, or dry zones. Wet soil and well-watered canopy tend to run cooler than dry soil and stressed plants under the same conditions. That contrast makes leaks and uneven water application visible across a field. The catch is timing: thermal contrast is strongest when the soil and canopy are under stress, so flights are usually scheduled around midday. Always confirm suspected leaks on the ground before scheduling repairs.
How often should you survey a field with a drone during the growing season?
Most irrigation programs benefit from a baseline flight before the season starts, then repeat surveys every 7 to 14 days during peak water demand. Sandy soils and shallow-rooted crops may need the shorter interval. The key is consistency: same altitude, same overlap, same time of day, so maps compare cleanly across dates. After a major irrigation change or a repair, a follow-up flight confirms whether the fix worked. Pair the schedule with in-field scouting so you are not relying on imagery alone.
Water stress rarely announces itself until yield is already lost. The growers who stay ahead of it survey on a schedule, verify on the ground, and adjust zones before the crop pays the price. Gods Eye Drone brings certified pilots, advanced FLIR thermal equipment, and multispectral survey capability to every mission, so you get aerial environmental intelligence you can act on, not just images. Book now with Gods Eye Drone and turn your next flight into a clear irrigation plan.