 how-to
How to Interpret Multispectral Drone Data for Crops
Table of Contents
- What Multispectral Drone Data Tells You About Crop Health
- NDVI vs NDRE for Crop Health: Which Index to Use and When
- The Multispectral Drone Data Processing Workflow: From Flight to Prescription Map
- Best Multispectral Drone Software for Turning Imagery Into Decisions
- Troubleshooting False Positives in Multispectral Imagery
- Calculating ROI: Is Multispectral Mapping Worth It for Small Farms?
- Frequently Asked Questions
Last Updated: September 16, 2026
What Multispectral Drone Data Tells You About Crop Health
Multispectral drone data is imagery captured across several discrete wavelength bands, including bands the human eye cannot see, that reveals crop stress before it becomes visible. A standard camera shows green plants; a multispectral sensor shows which are struggling and roughly why.
That gap matters because visible symptoms lag behind physiology: by the time yellowing shows up in a field walk, yield damage is often locked in. Our certified pilots fly multispectral missions for growers who want that earlier signal, the difference between a visual inspection and a calibrated index map is usually the difference between reacting and planning.
Spectral Bands and What They Measure
Each band captures reflectance in a narrow wavelength range and reveals something different about plant physiology.
- Blue and green (400-550 nm): baseline visible reflectance, useful for color correction and some pigment work
- Red (630-690 nm): absorbed heavily by healthy chlorophyll, so high red reflectance suggests pigment breakdown
- Red-edge (700-740 nm): the transition zone between red and near-infrared, and the single most sensitive band for early stress detection
- Near-infrared (750-900 nm): strongly reflected by healthy leaf cell structure, so low NIR reflectance points to damaged or stressed tissue
Healthy plants absorb red and reflect near-infrared; stressed plants do the opposite. Every vegetation index is a ratio built to exaggerate that contrast.
NDVI vs NDRE for Crop Health: Which Index to Use and When
NDVI is the general-purpose index; NDRE is what you reach for when NDVI stops being sensitive. NDVI combines red and near-infrared and works well for biomass and canopy cover. NDRE combines red-edge and near-infrared and picks up chlorophyll changes earlier, which matters most in dense, mature canopies where NDVI saturates.
The mechanism explains why the two indices disagree. NDVI is (NIR − Red) / (NIR + Red). In a sparse canopy, red reflectance is high because soil shows through, so the ratio moves a lot as the crop fills in, hence NDVI's value as an establishment and biomass index. Once the canopy closes, red reflectance drops to near zero because chlorophyll absorbs almost all of it, and NIR reflectance plateaus because leaf area stops increasing. Both numerator and denominator stop moving, so NDVI flattens out between roughly 0.8 and 0.95, no longer distinguishing a healthy field from a very healthy one.
NDRE is (NIR − Red Edge) / (NIR + Red Edge). Red-edge reflectance sits on the steep slope between red absorption and NIR scattering and keeps responding to chlorophyll concentration and leaf structure even when red reflectance has bottomed out. That is why NDRE still separates nitrogen status, disease onset, and senescence inside a canopy NDVI reads as uniformly good.
Matching the Index to Crop Stage
A practical way to sequence indices across a season:
- Emergence to early vegetative (sparse canopy): NDVI. You are measuring ground cover and stand establishment, and the soil-adjusted variants (SAVI, OSAVI) are worth running if bare soil is a large fraction of the frame.
- Canopy closure through reproductive: NDRE. This is where NDVI saturates and NDRE carries the signal. Nitrogen status, early disease, and water stress all show up here first.
- Senescence and maturity: NDRE plus a chlorophyll-sensitive index. NDVI will drop as the canopy dries down, but NDRE tells you whether the drop is uniform (normal maturity) or patchy (something else going on).
- Post-harvest or fallow: neither index is meaningful. Mask non-vegetation pixels and treat the field as a soil map.
Reading Index Values in the Field
Index values are not diagnoses on their own. NDVI runs from -1 to 1; for most field crops, bare soil sits near 0.1-0.2, moderate canopy around 0.4-0.6, and dense healthy canopy above 0.7. NDRE uses the same scale but a narrower band, a healthy closed canopy often sits around 0.3-0.5. Do not compare NDRE values to NDVI values directly; they are different scales with different thresholds.
What matters is the pattern, not the absolute number.
Look for three things:
- Zones, not pixels. A single low pixel is noise. A contiguous low zone is a real management area.
- Relative difference within the field. A field averaging 0.75 with a 0.55 patch is telling you something the average hides.
- Change over time. A zone that dropped between flights is more actionable than a zone that was always low.
When NDVI and NDRE Disagree
The disagreement between the two indices is itself a diagnostic. A common pattern: NDVI reads uniformly high, but NDRE shows a low patch. That usually means the canopy is dense enough to saturate NDVI but something is already limiting chlorophyll there, early nitrogen deficiency, a disease focus, or water stress. The NDVI map would have said the field was fine; the NDRE map tells you where to walk.
The reverse pattern, low NDVI, normal NDRE, is less common and usually points to a biomass or stand issue rather than chlorophyll: thin emergence, compaction, or a spray miss that cut plant count without yet affecting pigment.
USDA Agricultural Research Service remote sensing research
The Multispectral Drone Data Processing Workflow: From Flight to Prescription Map
The workflow from raw capture to a usable prescription map has six stages; skipping any degrades the output.
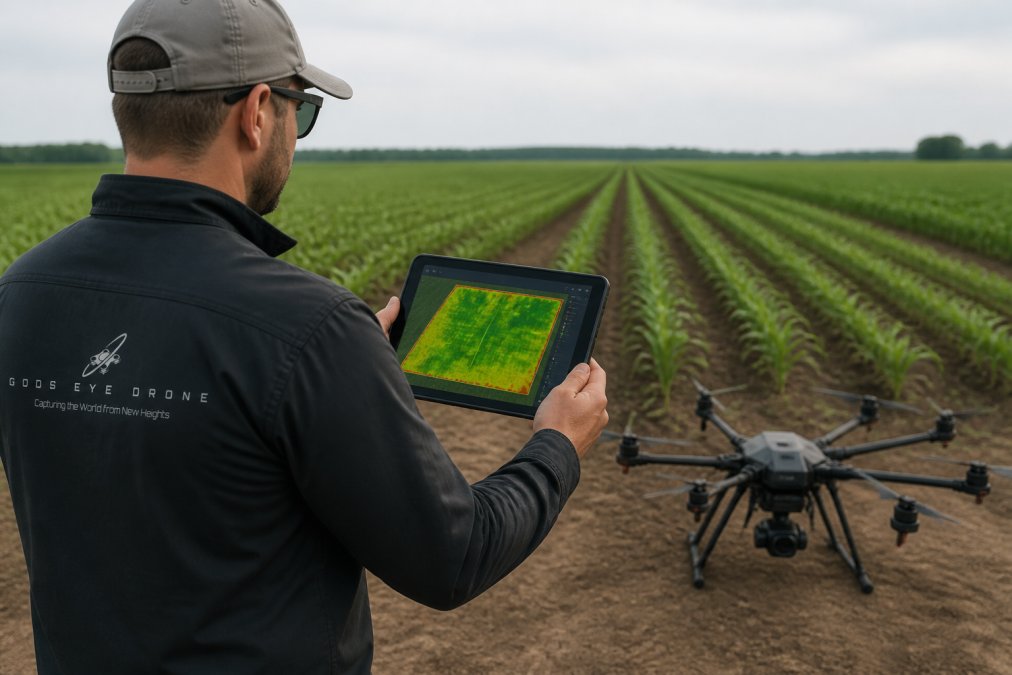
- Flight planning. Set altitude and overlap so ground sample distance matches the smallest zone you need to manage. Lower altitude means finer resolution and more images to process.
- Capture. Fly in consistent light, ideally within a narrow window, so reflectance values are comparable across the field.
- Radiometric calibration. Convert raw digital numbers to reflectance using a calibrated reference panel imaged before and after the flight.
Radiometric Calibration and Ground Truthing
Calibration makes values comparable; ground truthing makes them meaningful.
Best Multispectral Drone Software for Turning Imagery Into Decisions
Most articles on this topic are sensor-brand articles in disguise.
The Hardware-Agnostic Pipeline: Raw TIFF to Prescription Map
Stage 1, Ingest and inventory the raw capture. A multispectral flight produces one TIFF per band per capture point, plus a metadata file.
Choosing Software: What Actually Matters
When you evaluate options, score them against these criteria:
| Criterion | What to Check | Why It Matters |
|---|---|---|
| Calibration support | Reflectance panel workflow built in | Values comparable across flights |
| Index library | NDVI, NDRE, GNDVI, and custom band math | Match index to crop stage |
| Georeferencing | RTK or GCP support | Zones line up with the field |
| Masking tools | Soil and shadow masking before zoning | Removes the majority of false positives |
| Export formats | Shapefile, GeoTIFF, ISO-XML | Feeds application equipment |
| Processing model | Cloud vs. desktop | Affects turnaround and cost |
A Note on Sensor-Agnostic Interpretation
If you switch sensors between seasons, or hire a service flying a different payload, the pipeline still holds, but two things change.
Troubleshooting False Positives in Multispectral Imagery
Calculating ROI: Is Multispectral Mapping Worth It for Small Farms?
Work through it with your own numbers:
- Identify the decisions mapping could inform this season (nitrogen rate, irrigation timing, replant zones).
- Estimate the input cost per acre you could reduce or redirect.
- Estimate the yield value at risk in the zones you cannot currently see.
- Compare that total against your per-acre mapping cost.
NRCS conservation and precision agriculture guidance
Frequently Asked Questions
What is the most common vegetation index used in multispectral drone analysis?
NDVI is the most widely used vegetation index for multispectral drone data. It compares near-infrared and red reflectance to measure chlorophyll content and biomass. Values range from -1 to 1, with healthy vegetation typically falling between 0.6 and 0.9. NDVI works well for mid-season canopy assessment but saturates in dense canopies, which is why NDRE becomes more useful later in the season when you need to detect subtle nutrient deficiency or water stress.
How does multispectral imaging differ from standard RGB drone photography?
RGB cameras capture only visible light in red, green, and blue bands. Multispectral sensors capture those bands plus near-infrared and red-edge wavelengths that are invisible to the human eye but strongly tied to plant physiology. That extra spectral data lets you calculate vegetation indices like NDVI and NDRE, which reveal crop stress before it shows visually. RGB imagery shows you what a field looks like; multispectral data shows you how the plants are actually performing.
How often should drone multispectral flights be conducted during the growing season?
Most agronomists recommend flying every 7 to 14 days during active growth stages, depending on crop type and how quickly conditions change. Critical growth stages like early vegetative and reproductive phases benefit from tighter intervals. After a significant weather event, such as heavy rain or a heat spike, an additional flight can catch water stress or disease pressure early. Consistent flight timing matters more than frequency because it lets you compare data across the season.
What are the common challenges when interpreting multispectral imagery?
The biggest issues are false positives from soil background, shadows, or weeds, and inconsistent results caused by skipping radiometric calibration or flying under uneven cloud cover. Another challenge is interpreting data without ground truthing. A low NDVI zone could mean nutrient deficiency, water stress, or a pest infestation, and the index alone cannot tell you which. Pairing multispectral drone data with scouting notes and soil samples gives you the context to make the right call.
Crop stress does not wait for a field walk, and the window between a multispectral signal and a visible symptom is where yield is won or lost. Gods Eye Drone provides calibrated multispectral capture, index mapping, and prescription-ready exports from certified pilots, backed by veteran-owned service and advanced sensor technology. Get started with Gods Eye Drone and turn your imagery into field-level decisions this season.