 ultimate-guide
Drone Soil Analysis for Nutrient Management
Table of Contents
- Why Drone Soil Analysis is Vital for Nutrient Management
- How Drone Sensors Capture Soil Data
- Multispectral Imaging for Agriculture
- Creating Field Management Zones for Precision Application
- Variable Rate Fertilizer Application and Input Optimization
- Benefits of Drone Mapping for Small Farms
- Real-World Implementation and ROI Considerations
- Frequently Asked Questions
Last Updated: September 17, 2026
Why Drone Soil Analysis is Vital for Nutrient Management
Drone soil analysis captures detailed geospatial data across every acre, revealing nutrient hotspots and deficiencies that broad, field-wide soil samples miss.
Multispectral imaging and real-time data processing enable the shift from uniform fertilizer application to variable rate strategies, optimizing input costs and yields.
Soil nutrient distribution is never uniform. Without site-specific management, farmers either overapply inputs to ensure coverage in poor zones or underapply to avoid waste in rich zones, both approaches waste money and harm sustainability.
Drone soil analysis provides the spatial intelligence needed for informed decisions about fertilizer application and field management zones.
How Drone Sensors Capture Soil Data
UAV-mounted multispectral sensors collect continuous data across the entire field by detecting light reflectance patterns, creating detailed soil maps without the time and cost of traditional point sampling.
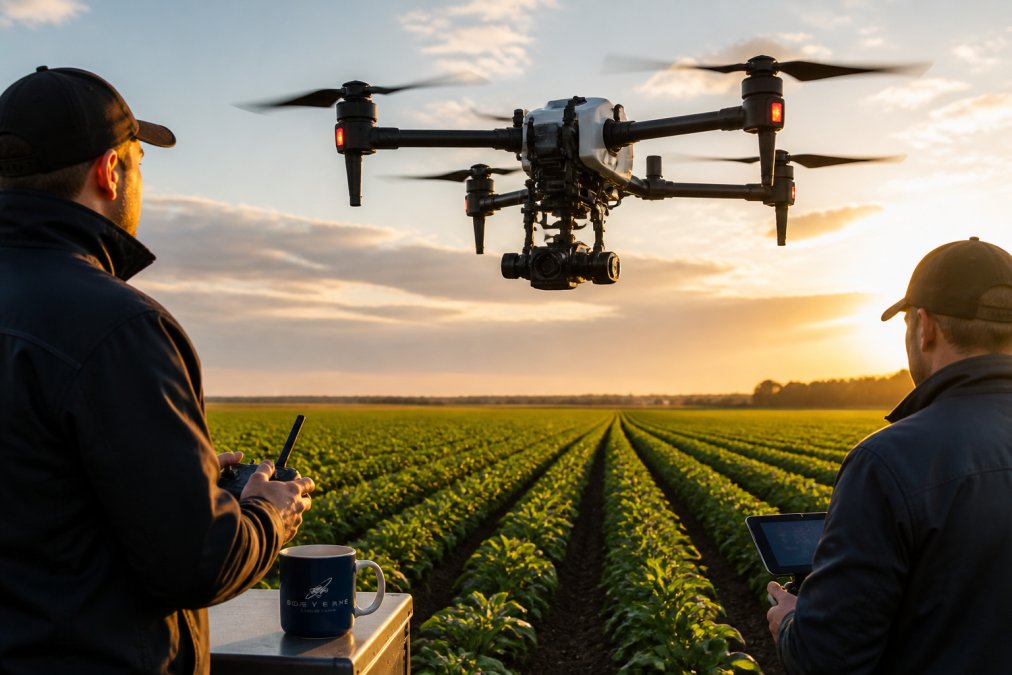
Multispectral cameras detect wavelengths reflected by soil and vegetation, revealing insights about soil health, nutrient availability, and crop stress.
Sensor data is processed into georeferenced imagery that maps to specific field coordinates, forming the foundation for field management zones and variable rate application maps.
Drone sensors deliver high-resolution coverage across the entire field with minimal data gaps, better detail than satellite imagery and fewer interpolation gaps than point sampling.
Multispectral Imaging for Agriculture
Multispectral imaging captures data across multiple wavelength bands, quantifying spatial variability to support data-driven decisions. Understanding both its power and limitations is essential for realistic implementation.
How Multispectral Sensors Work
Multispectral cameras typically capture 4-10 wavelength bands (blue, green, red, red-edge, near-infrared, and sometimes shortwave-infrared), each revealing different information:
- Red and near-infrared bands: Detect chlorophyll content and biomass; used to calculate NDVI (Normalized Difference Vegetation Index)
- Red-edge band: More sensitive to chlorophyll than standard red; useful for detecting early nutrient stress before visible symptoms appear
- Blue and green bands: Detect soil color and moisture; useful for bare soil mapping
- Shortwave-infrared (if available): Penetrates cloud cover and detects soil moisture at depth
NDVI (Normalized Difference Vegetation Index) is the most commonly used index, calculated as (Near-Infrared − Red) / (Near-Infrared + Red). Higher values indicate denser vegetation; NDVI patterns reveal areas of crop stress indicating nutrient deficiencies, water stress, or disease.
Advanced sensors also measure GNDVI (more sensitive to chlorophyll in dense crops), OSAVI (reduces soil background noise in early-season conditions), and soil indices (bare soil, organic matter, moisture).
The Correlation Problem: Why Drone Data Requires Validation
Multispectral reflectance correlates with crop health but does not measure it directly. High NDVI indicates green, vigorous crops but not why, nitrogen may be adequate, or phosphorus deficiency may constrain yield despite apparent vigor.
Drone imagery reveals spatial patterns in crop condition, but translating them into nutrient recommendations requires calibration against actual soil chemistry. Without calibration, prescription maps are estimates, not data.
Example: two zones show NDVI of 0.65, but soil testing reveals Zone A has 180 lbs available nitrogen per acre (adequate) while Zone B has 80 lbs (deficient). Drone imagery alone cannot distinguish these zones.
The most effective approach combines drone imagery with targeted soil sampling: imagery identifies zones, soil sampling validates whether reflectance patterns correspond to nutrient differences, correlation analysis quantifies relationships, and prescription maps are built on validated data, not assumptions. Skipping validation saves money short-term but produces inaccurate maps.
Accuracy and Limitations of Multispectral Analysis
Drone multispectral imagery has well-documented limitations that affect its utility for soil nutrient assessment:
Spatial resolution: Standard drones capture 1-3 cm per pixel imagery, excellent for field-scale patterns but may miss small patches (smaller than 10 feet).
Temporal limitations: Drone flights capture a single snapshot. Nutrient availability shifts throughout the season as crops take up nutrients and mineralization occurs.
Depth limitations: Multispectral reflectance detects only the top 1-2 inches of soil. Subsurface nutrient stratification, common in fields with long fertilizer histories, remains invisible.
Crop stage sensitivity: NDVI is most reliable with sufficient canopy. Early-season sparse canopy and late-season senescence reduce reflectance reliability.
Weather and atmospheric effects: Cloud cover, haze, and sun angle affect reflectance. Consistent flight timing (mid-morning, clear skies) improves data quality but constrains scheduling.
Soil moisture effects: Wet soil reflects less light than dry soil, independent of nutrients. Recent irrigation or rain creates false spatial patterns if flights are not timed consistently.
When Drone Analysis Fails: Situations Requiring Traditional Soil Testing
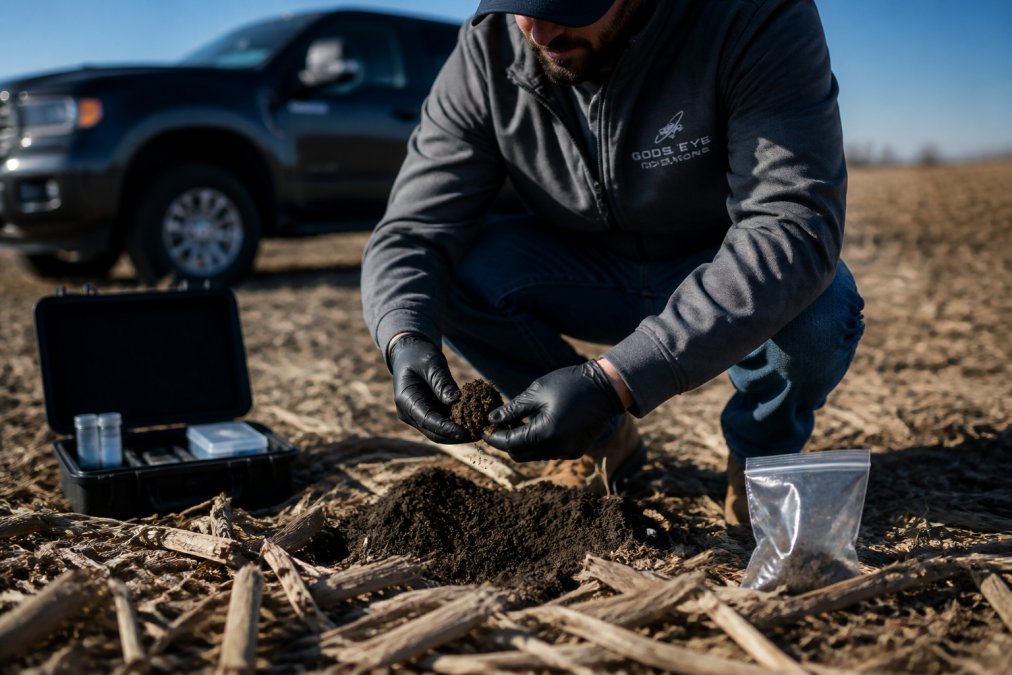
Drone imaging complements but does not replace soil testing. Soil sampling is required for: subsurface nutrient assessment (below 1-2 inches), distinguishing specific nutrient deficiencies, measuring pH and organic matter, establishing baseline data, and validating drone estimates (typically 3-5 samples per field annually).
Practical Integration: Drone Imagery + Soil Testing
Year 1: Conduct comprehensive soil testing (1 sample per 40 acres), capture drone imagery, and correlate to build a calibration model. Year 2+: Use drone imagery to identify zones and validate with 3-5 targeted samples per field. This reduces sampling costs while maintaining accuracy.
Drone multispectral imaging identifies spatial patterns and prioritizes sampling locations, but soil chemistry answers what to do.
Creating Field Management Zones for Precision Application
Field management zones are discrete areas sharing similar soil characteristics and yield potential. Drone soil analysis reveals spatial patterns in nutrient distribution; multispectral imagery identifies clusters of similar reflectance validated against soil chemistry and yield records. Most operations find 5-15 zones per field provide practical balance between precision and manageability. Variable rate equipment adjusts fertilizer rates in real time, reducing overall use while ensuring adequate supply to deficient areas.
Variable Rate Fertilizer Application and Input Optimization
Variable rate application delivers different nutrient amounts to different zones based on drone soil analysis, soil chemistry, and yield history. GPS guidance and real-time rate controllers adjust output continuously, preventing overapplication in nutrient-rich areas and underapplication in deficient zones. Measurable benefits include 10-20% reduction in total fertilizer use while maintaining or improving yields, with reduced nutrient runoff and improved soil health.
Benefits of Drone Mapping for Small Farms
Drone mapping delivers outsized benefits for smaller operations because cost per acre decreases relative to input savings. A single flight captures data across 100-200 acres in hours; zones and prescription maps can be reused for multiple seasons. Fewer zones mean simpler implementation. Drone mapping reveals patterns, organic matter variation, pH shifts, that enable more confident input allocation decisions.
Real-World Implementation and ROI Considerations
Implementing drone soil analysis requires planning across data collection timing, software integration, equipment compatibility, and workflows. Real-world payback depends on field conditions, input costs, and integration complexity, not simplified marketing ROI calculations.
Financial Modeling and Payback Periods
Direct costs: drone imagery ($0.50-$1.50/acre), validation sampling ($15-$30/sample, typically 3-5 per field), prescription map development ($200-$500/field), and equipment modifications ($0-$5,000). Measurable savings emerge from 10-20% fertilizer reduction in variable-rate fields. On a 500-acre operation at 150 lbs N/acre at $0.65/lb, a 15% reduction saves ~$7,300 annually in nitrogen alone, plus $1,500-$3,000 in phosphorus and potassium.
Data Integration Challenges and Software Compatibility
A major hidden cost is integrating drone data with existing farm management systems. Data flows through processing software (Pix4D, DroneDeploy) → FMS (John Deere Operations Center, AGCO Fuse) → applicator rate controllers. Compatibility issues arise at each step; not all FMS platforms accept the same map formats, and GPS accuracy drift (3-5 feet) between drone imagery and tractor guidance can cause zone boundary misalignment.
Regulatory Compliance and Operational Constraints
FAA Part 107 regulations require: Remote Pilot Certificate, visual line of sight (100-400 feet altitude), airspace clearance near airports, and weather minimums (daylight, 3+ statute miles visibility, no precipitation). These constraints limit flights to 2-4 week windows during optimal crop height and weather; missing the window delays data collection a full season.
Accuracy Thresholds and Validation Requirements
Drone imagery provides 1-3 foot spatial accuracy but does not guarantee nutrient estimate accuracy. Reflectance data correlates with conditions but requires calibration against soil chemistry. Validation requires targeted sampling at 3-5 locations per zone, lab analysis, and correlation analysis. Without validation, prescription maps are educated guesses; with it, they become reliable. Validation sampling ($15-$30/sample) is modest compared to applying incorrect maps.
Timeline for Implementation
Implementation spans 8-12 weeks: flight scheduling (weeks 1-2), imagery capture (weeks 2-3), data processing (weeks 3-4), soil sampling and lab analysis (weeks 4-5), prescription map development (weeks 5-6), equipment setup (weeks 6-8), and application (weeks 8-12). Delays compress remaining timelines; late-season flights may delay application by months. Experienced providers who understand agronomic and technical dimensions, FMS integration, validation sampling, equipment compatibility, reduce friction and accelerate payback.
Frequently Asked Questions
How does drone soil analysis compare to traditional soil sampling methods?
Drone soil analysis using multispectral imaging captures spatial variability across entire fields in hours, whereas traditional sampling collects data from discrete points. Drones identify nutrient hotspots and bare soil areas that manual sampling might miss. Traditional methods remain valuable for soil texture and pH verification, but drones excel at mapping organic matter distribution and predicting yield potential across variable terrain. Many operations combine both approaches for comprehensive crop nutrient management.
What specific data do drones collect for soil health mapping?
Agricultural drones equipped with multispectral sensors capture NDVI (normalized difference vegetation index), soil moisture levels, and organic matter distribution. These sensors detect wavelengths invisible to human eyes, revealing nutrient stress before visible crop damage occurs. Drones also generate geospatial data that identifies field management zones with different soil textures and fertility levels. Real-time monitoring allows agronomists to create site-specific management recommendations tailored to each zone's actual nutrient status.
Can drone-based soil analysis reduce fertilizer costs?
Yes. Variable rate application based on drone-derived soil maps eliminates over-application in low-nutrient areas and prevents waste in high-fertility zones. Farmers using precision agriculture techniques informed by drone data typically reduce fertilizer input costs by optimizing application rates to actual field conditions. The savings compound over multiple seasons, and the environmental benefit of reduced nutrient runoff adds long-term sustainability value. ROI depends on field size and application frequency, which is why professional assessment of your operation's specific conditions matters.
What are the main limitations of drone soil analysis?
Drone multispectral imaging cannot directly measure soil pH or nutrient concentrations, it infers them from vegetation and surface conditions. Accuracy depends on sensor calibration, atmospheric conditions, and ground-truth verification through traditional soil samples. Cloud cover and wet soil can interfere with data collection. Drones also have regulatory restrictions and cannot operate safely in all weather. These limitations mean drone analysis works best as part of an integrated approach, not as a complete replacement for field scouting and laboratory testing.