 ultimate-guide
Agricultural Crop Monitoring: Multispectral Analysis Guide
Table of Contents
- What Is Multispectral Crop Monitoring and Why It Matters
- Principles of Multispectral Imaging in Agriculture
- NDVI Crop Health Monitoring and Vegetation Indices
- Drone vs. Satellite Data for Crop Monitoring
- Drone Multispectral Sensor Comparison and Selection
- Multispectral Drone Flight Planning and Data Acquisition
- Data Processing Workflow and Software Tools
- Practical Applications: Early Stress Detection and Input Optimization
- Frequently Asked Questions
Last Updated: August 30, 2026
What Is Multispectral Crop Monitoring and Why It Matters
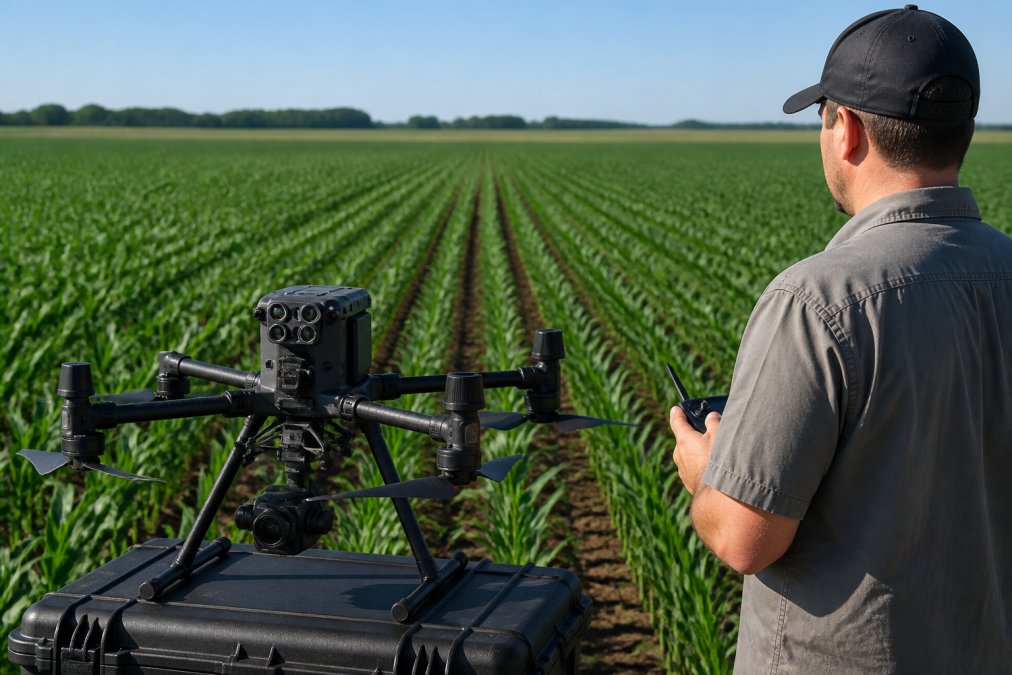
Multispectral crop monitoring captures data across multiple wavelengths of light, visible, near-infrared, and red-edge bands, to assess plant health and predict yield before visual symptoms appear. Unlike standard RGB photography, multispectral analysis reveals crop physiological state by measuring how plants reflect and absorb light at specific wavelengths, enabling proactive rather than reactive management.
This early warning window enables intervention, adjusting irrigation, applying targeted inputs, or modifying practices, before yield loss occurs. Multispectral data reveals exactly where problems exist, their severity, and spatial distribution, enabling variable rate application where inputs are deployed only where needed.
Principles of Multispectral Imaging in Agriculture
Multispectral imaging captures reflected light in discrete bands across the electromagnetic spectrum. Agricultural applications typically use 4-13 spectral bands: blue, green, red, near-infrared, and red-edge wavelengths. Each band reveals different plant characteristics because vegetation reflects, absorbs, and transmits light differently by wavelength.
The fundamental principle is spectral signature, the unique pattern of reflectance across wavelengths that characterizes plant condition. Healthy vegetation shows low reflectance in the visible spectrum (chlorophyll absorbs red and blue light) and high reflectance in near-infrared (leaf cell structure reflects infrared). When plants experience stress, water deficit, nutrient limitation, disease, or pest pressure, this signature changes measurably before visible symptoms emerge.
How Spectral Bands Reveal Crop Health
The red band (620-750 nm) captures chlorophyll absorption; reduced red reflectance indicates lower chlorophyll and reduced photosynthetic capacity. The near-infrared band (760-1100 nm) is the workhorse of agricultural remote sensing, healthy leaves reflect 40-50% of incident near-infrared light, while stressed leaves reflect less, making this the most reliable single band for detecting stress before visibility.
The red-edge band (680-730 nm) sits between red and near-infrared and is particularly sensitive to chlorophyll content and early stress detection. As chlorophyll declines from drought, nutrient deficiency, or disease, the reflectance peak shifts, red-edge reflectance increases while red reflectance decreases, before leaves show visible yellowing or wilting.
Near-Infrared and Red-Edge Data
Near-infrared reflectance increases with leaf area and biomass, useful for estimating canopy cover and growth stage. Red-edge reflectance responds more sensitively to chlorophyll concentration and nutrient stress. Red-edge indices remain sensitive across wider biomass ranges, making them more reliable for monitoring dense canopies where near-infrared saturation occurs.
NDVI Crop Health Monitoring and Vegetation Indices
NDVI crop health monitoring uses mathematical transformation of spectral bands to isolate vegetation signal from soil and atmospheric noise. The Normalized Difference Vegetation Index (NDVI) is calculated as (NIR - Red) / (NIR + Red), ranging from -1 to +1, with healthy vegetation typically scoring 0.4-0.9 depending on crop type, growth stage, and density.
NDVI is widely adopted because it's simple to calculate, strong across different sensors and lighting conditions, and strongly correlated with crop biomass and productivity. However, NDVI saturates in dense canopies, once vegetation cover exceeds 70-80%, further biomass increases produce little NDVI change, which is why red-edge indices are increasingly important for mid-to-late season monitoring.
Understanding NDVI, NDRE, and LAI
NDVI works well for early-season detection and sparse-to-moderate canopy conditions. Values below 0.4 indicate stressed or sparse vegetation; 0.6-0.8 indicate healthy, moderate-to-dense vegetation. Sudden NDVI drops signal stress, disease, water deficit, or nutrient limitation.
NDRE (Normalized Difference Red Edge Index), calculated as (NIR - Red Edge) / (NIR + Red Edge), remains sensitive in dense canopies where NDVI saturates. NDRE is particularly useful mid-season for monitoring chlorophyll content and predicting yield in high-biomass crops.
LAI (Leaf Area Index), the ratio of total leaf area to ground area, ranges from 0 (bare ground) to 6-8 (dense canopy). LAI directly relates to light interception, photosynthetic capacity, and yield potential, making it one of the most agronomically meaningful metrics from remote sensing.
Interpreting Index Values for Decision-Making
Interpretation requires context: growth stage, weather history, soil type, and ground truthing. The key is change detection, comparing NDVI maps week-to-week reveals improving or deteriorating conditions. A section dropping from 0.7 to 0.6 in one week needs attention; dropping from 0.5 to 0.4 over four weeks might be normal maturation. Establishing baseline values for your specific crops, soils, and climate is essential for meaningful interpretation.
Drone vs. Satellite Data for Crop Monitoring
Satellites like Sentinel-2 provide consistent global coverage at low cost, but spatial resolution is coarse (10 meters per pixel), temporal resolution is limited (5-10 days between passes), and cloud cover often blocks observations during critical growth periods. For field-level decisions, 10-meter pixels are too coarse to identify problems in specific sections or rows.
Drones provide 2-5 centimeter per pixel resolution, fly on-demand regardless of cloud cover, and collect data at exact timing needed for agronomic decisions. Trade-offs include cost, operational complexity, and limited range per flight, typically 100-300 acres depending on altitude and flight time. Many operations use both: satellite data for broad-scale monitoring and drone data for targeted investigation and management decisions.
Drone Multispectral Sensor Comparison and Selection
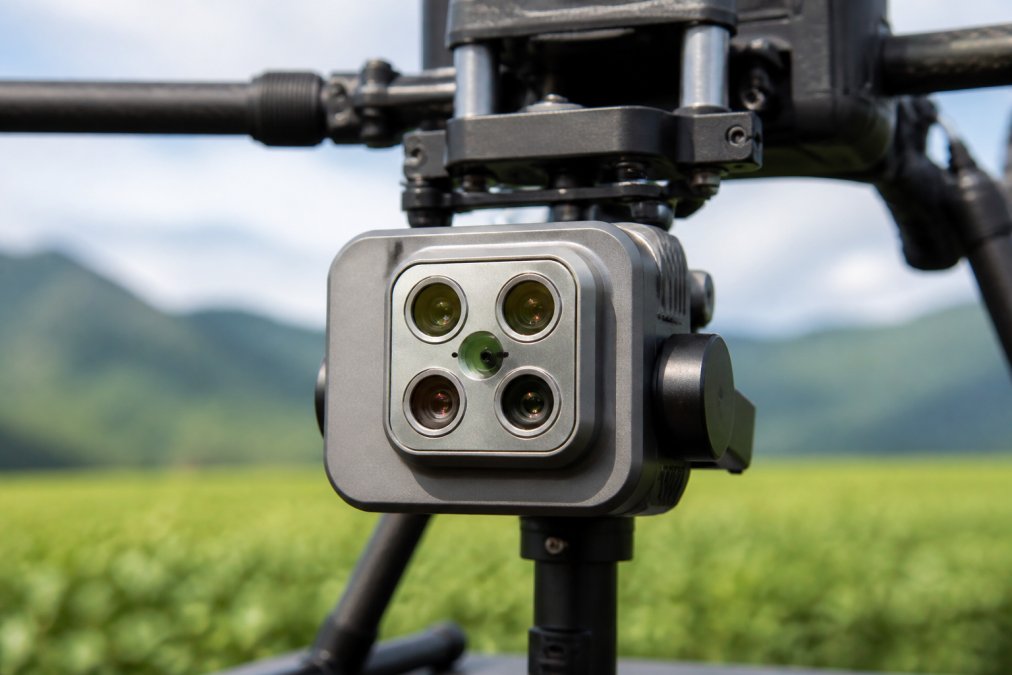
Multispectral sensors for drones range from simple RGB+NIR systems with 4 bands to advanced hyperspectral systems with 50+ bands. For agricultural crop monitoring, 5-6 band systems (RGB + NIR + Red-edge) represent the practical sweet spot between capability and cost, capturing spectral information most relevant to crop health without hyperspectral processing overhead.
Sensor Types and Spectral Resolution
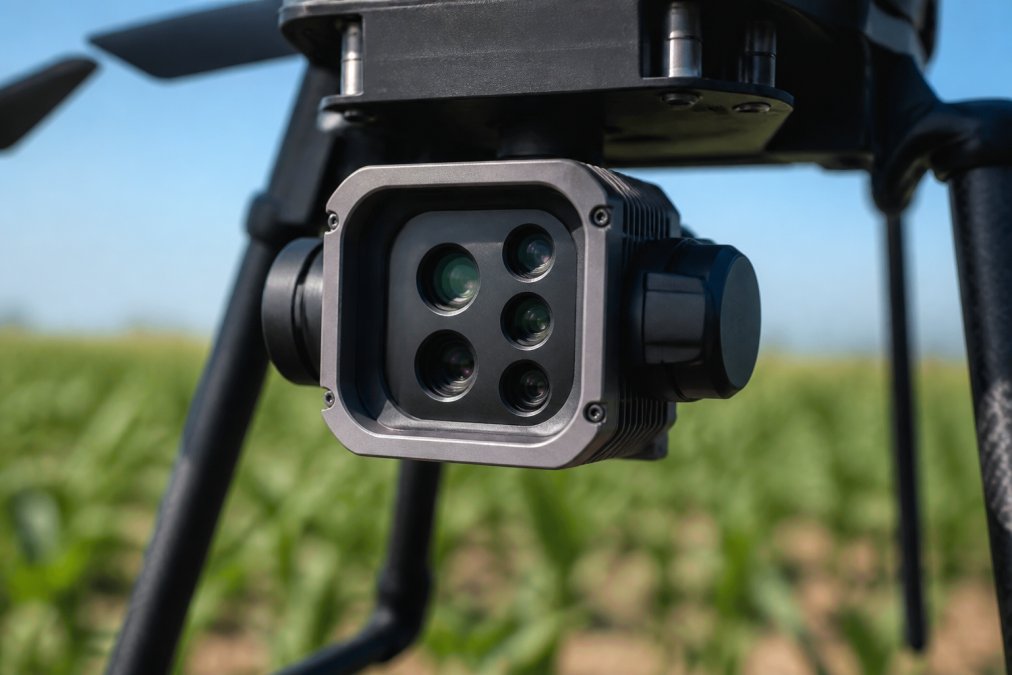
Fixed-lens multispectral cameras like the Micasense RedEdge or Parrot Sequoia mount directly to the drone and capture all bands simultaneously. These systems are lightweight, reliable, and produce well-registered imagery. Thermal cameras add temperature data, which correlates with water stress and reveals irrigation problems or disease development.
Spatial Resolution and Flight Altitude Trade-Offs
Spatial resolution depends on sensor pixel size and flight altitude. A 4-megapixel sensor flying at 120 meters produces roughly 5 cm per pixel resolution; at 60 meters produces 2.5 cm per pixel. Higher resolution captures finer detail but requires lower altitude flights and more battery cycles to cover the same area. For detecting large stress patches (10+ meters across), 5 cm resolution is adequate; for row-level or individual-plant stress, 2-5 cm resolution is necessary.
Multispectral Drone Flight Planning and Data Acquisition
Successful multispectral flights require careful planning around phenological stage, weather, and radiometric conditions. Flying at the wrong growth stage captures data mismatched to the agronomic question. Flying in poor lighting or atmospheric conditions produces noisy, unreliable data.
Flight Timing and Phenological Stages
Optimal flight timing depends on the management decision. For early stress detection, fly during V4-V6 in corn or early growth in other crops, when problems are emerging but the crop is still responsive to corrective action. For yield prediction, fly during grain fill (R4-R5 in corn) or pod fill (R4-R5 in soybeans), when biomass and canopy structure correlate strongly with final yield. Avoid flying immediately after rain or during extreme heat.
Radiometric Calibration and Ground Truthing
Radiometric calibration converts raw sensor counts to reflectance values comparable across flights, dates, and sensors. Most drone multispectral systems require a calibration panel, a white or gray reference target of known reflectance, flown in the same mission as the crop survey. Without calibration, comparing NDVI values across different dates or sensors is unreliable.
Ground truthing means collecting validation data on the ground: spectral measurements with a handheld spectrometer, plant samples for biomass or chlorophyll analysis, or yield monitor data from harvest. Ground truth data is essential for calibrating index thresholds and validating that observed spectral patterns correspond to agronomic conditions.
Troubleshooting Sensor Artifacts and Data Quality
Common artifacts include vignetting (darkening at image edges), bidirectional reflectance effects (apparent reflectance changes due to sun angle and sensor viewing angle), and atmospheric scattering (haze reducing contrast). Misregistration between bands causes spectral errors in index calculations. Modern multispectral cameras register bands to within 1-2 pixels. Regular maintenance and periodic recalibration protect against sensor drift.
Data Processing Workflow and Software Tools
Raw drone imagery requires significant processing before becoming actionable agricultural information. The workflow includes radiometric correction, orthomosaic generation, index calculation, and spatial analysis, transforming thousands of individual images into georeferenced, analysis-ready data products.
Orthomosaic Generation and Georeferencing
Orthomosaic generation combines hundreds or thousands of overlapping drone images into a single, seamless, georeferenced map using structure-from-motion photogrammetry. The process identifies matching features across images, calculates camera position and orientation for each image, and creates a 3D point cloud. The point cloud is then projected onto a 2D map surface, creating an orthomosaic where every pixel has a known geographic coordinate.
Georeferencing anchors the orthomosaic to a real-world coordinate system using drone GPS and, ideally, ground control points, surveyed targets placed in the flight area before the mission. Drones have onboard GPS accurate to 1-3 meters; ground control points improve accuracy to 5-10 centimeters. For precision input application, sub-meter accuracy is adequate.
Index Calculation and Yield Mapping
Once the orthomosaic is created, spectral indices like NDVI, NDRE, and LAI are calculated pixel-by-pixel using reflectance values from each band. Yield mapping connects index values to actual yield data from harvest monitors, establishing the relationship between mid-season spectral data and final productivity. This relationship, once established for a specific field and crop, predicts yield from future multispectral flights.
Software tools range from open-source options like QGIS and Python libraries to commercial platforms like Pix4Dfields, DJI Terra, and Trimble UAS Master. Gods Eye Drone uses industry-standard processing software to ensure data quality and compatibility with standard agricultural decision-making platforms.
Practical Applications: Early Stress Detection and Input Optimization
The ultimate value of multispectral crop monitoring lies in actionable decisions: detecting problems early, optimizing input application, and improving yield and profitability.
Detecting Crop Stress Before Visual Symptoms Appear
Spectral indices detect stress 2-3 weeks before visible symptoms like yellowing or wilting appear. This early warning window is critical because it preserves management options. A sudden NDVI drop in a field section signals emerging stress, water deficit, nutrient limitation, disease, or pest pressure, allowing corrective action while the crop is still responsive. Establishing a baseline for your field and crop is essential; a healthy corn field at V6 might have NDVI of 0.6-0.7; if a section drops to 0.5, that's a 15% decline warranting investigation.
Variable Rate Application and Precision Input Management
Once stress areas are identified, multispectral data guides variable rate application, applying inputs at rates matched to spatial variability in crop need. Instead of applying uniform nitrogen across a field, variable rate application uses NDVI or NDRE maps to apply higher rates where NDVI is low and lower rates where NDVI is high. This approach reduces total input cost, improves yield uniformity, and reduces environmental impact.
Growth Stage Monitoring and Biomass Estimation
Multispectral data tracks crop development through the season, providing early warning of delayed growth or abnormal development. Comparing NDVI or LAI maps from sequential flights reveals whether the crop is on track for normal development or lagging. Biomass estimation uses the relationship between spectral indices and actual plant biomass to predict above-ground biomass at any point in the season. Mid-season biomass estimates provide early yield forecasts; a field with below-normal biomass at R2 is unlikely to achieve full-season yield potential.
Multispectral crop monitoring transforms how farmers and agricultural managers understand field conditions and make decisions. The technology bridges the gap between broad-scale satellite imagery and intensive ground scouting, providing spatial detail at agronomic timing.
At Gods Eye Drone, we bring certified expertise and state-of-the-art equipment to agricultural multispectral analysis. Our team understands the agronomic questions driving the work and delivers data products designed for real management decisions. From flight planning through post-processing and interpretation, we handle the technical complexity so you can focus on the agronomic outcome. Book Now to discuss your crop monitoring needs and see how multispectral analysis can improve your operation.
| Stage | Optimal Flight Timing | Key Indices | Primary Use |
|---|---|---|---|
| Early Growth (V4-V6) | 4-6 weeks after planting | NDVI, NDRE | Stress detection, input adjustment |
| Mid-Season (V10-R2) | 8-10 weeks after planting | NDVI, LAI, NDRE | Growth monitoring, yield forecasting |
| Grain Fill (R4-R5) | 12-14 weeks after planting | NDVI, NDRE, LAI | Biomass estimation, final yield prediction |
| Late Season (R6) | 16+ weeks after planting | NDVI, thermal | Disease monitoring, harvest planning |
USDA guidance on precision agriculture and remote sensing
American Society of Agronomy research on vegetation indices and crop monitoring
IEEE standards for remote sensing data quality and accuracy
Frequently Asked Questions
Q: How does multispectral imaging work for crop health monitoring?
A: Multispectral sensors capture light reflectance across multiple wavelengths, including visible red, near-infrared, and red-edge bands. Healthy plants reflect more near-infrared light due to chlorophyll content and leaf structure. By comparing reflectance across spectral bands, vegetation indices like NDVI reveal chlorophyll concentration and biomass without direct contact. This data reveals crop stress, nitrogen deficiency, and disease pressure weeks before visual symptoms appear, enabling early intervention.
Q: What is NDVI crop health monitoring and how do I interpret the values?
A: NDVI (Normalized Difference Vegetation Index) is calculated from near-infrared and red reflectance: (NIR - Red) / (NIR + Red). Values range from -1 to +1. Healthy vegetation typically scores 0.6 to 0.9; stressed or sparse vegetation scores below 0.4. Higher NDVI indicates greater leaf area, chlorophyll content, and biomass. Monitoring NDVI over time reveals growth trajectories and stress onset. Comparing NDVI across field zones identifies management-responsive areas for variable rate fertilizer or irrigation application.
Q: What is the difference between drone and satellite multispectral data for agriculture?
A: Drones offer 1-5 cm spatial resolution, daily revisit capability, and flexible scheduling; satellites provide 3-10 meter resolution with fixed revisit cycles (5-16 days). Drones excel at detecting localized stress, pest damage, and small-field variability. Satellites cover large regions cost-effectively but miss fine-scale patterns. For precision agriculture on fields under 500 acres, drones deliver superior agronomic decision-making. Satellites suit regional monitoring and large commodity operations. Many operations combine both for comprehensive phenotyping.
Q: How often should I conduct multispectral drone flights during the growing season?
A: Flight frequency depends on crop, growth stage, and management goals. Critical periods are V4-V6 (early vegetative), R1-R2 (flowering/pod set), and R5-R6 (grain fill). Minimum: 3-4 flights per season (early, mid, late season). Intensive monitoring: weekly or bi-weekly flights during high-risk periods (drought, pest pressure, disease outbreak). Post-application flights (48-72 hours after fungicide, herbicide, or fertilizer) validate treatment efficacy. Phenological stage, not calendar date, drives timing, prioritize growth stages over fixed intervals.
Q: What software do I need to process multispectral agricultural data?
A: Standard workflow uses photogrammetry software (Pix4D, DroneDeploy, Agisoft Metashape) for orthomosaic and point cloud generation, then spectral analysis tools (QGIS, ArcGIS, Envi) for index calculation and yield mapping. Many drone manufacturers bundle proprietary software. Open-source alternatives include GDAL and Python libraries (rasterio, scikit-image). Processing includes radiometric calibration, georeferencing, and index computation. Cloud platforms (DroneDeploy, Agribotix) automate workflows. Choose based on field size, sensor type, and expertise, professional services handle processing for operators without in-house GIS capacity.
Q: What causes sensor artifacts in multispectral drone imagery and how do I fix them?
A: Common artifacts include vignetting (darkened edges), radiometric errors from uneven lighting, and geometric distortion from camera tilt. Causes: improper radiometric calibration, flying in variable cloud cover, or sensor misalignment. Prevention: use calibration panels (white/gray references) before and after flights, fly in consistent lighting (midday, clear skies), and validate sensor alignment. Post-processing correction uses calibration panel data to normalize reflectance. Ground truthing (spectroradiometer measurements at known points) validates corrected data. Poor image overlap or GPS drift causes georeferencing errors, ensure 70%+ overlap and accurate ground control points.
Q: Can multispectral crop monitoring predict yield before harvest?
A: Yes. Yield prediction models correlate mid-season NDVI, LAI (leaf area index), and biomass estimates with historical yield data. R-squared values of 0.75-0.90 are typical when models account for variety, soil, and weather. Predictions improve when combined with grain fill stage imagery (R5-R6) and weather data. Early-season NDVI (V6-V8) predicts yield potential; late-season indices refine estimates. Accuracy depends on calibration data quality and environmental consistency. Professional services integrate multispectral data with agronomic records to build field-specific prediction models.
This article was written using GrandRanker