 comparison
Fixed-Wing Aircraft for Agricultural Mapping: A 2026 Guide
Table of Contents
- Why Fixed-Wing Aircraft Matter for Agricultural Mapping
- Fixed-Wing vs Multirotor Drone for Mapping: Which Covers More Ground
- Sensor Payloads: RGB, Multispectral, Thermal, and LiDAR Options
- Multispectral Drone for Crop Monitoring: Vegetation Indices and Irrigation Analysis
- Drone Mapping Flight Planning: Mission Design and Coverage Strategy
- Accuracy, Georeferencing, and Orthomosaic Deliverables
- Total Cost of Ownership and Operational Workflow
- Frequently Asked Questions
Last Updated: October 4, 2026
Why Fixed-Wing Aircraft Matter for Agricultural Mapping
Fixed-wing aircraft for agricultural mapping have become essential for farms managing hundreds or thousands of acres, capturing entire fields in hours with precision that informs irrigation, fertilizer, and harvest decisions.
A multirotor drone covers 100-150 acres per flight; a fixed-wing aircraft covers 500-1,000 acres in the same timeframe. For large operations, this difference determines whether you get actionable data or outdated information.
Fixed-wing systems are transformative for monitoring crop stress, detecting irrigation issues, and planning precision applications. Multispectral imagery, thermal readings, and elevation models feed directly into agronomic decisions that move the needle on yield.
The choice between a fixed-wing drone, a crewed aircraft, or a multirotor depends on your acreage, sensor needs, budget, and decision timeline.
Fixed-Wing vs Multirotor Drone for Mapping: Which Covers More Ground
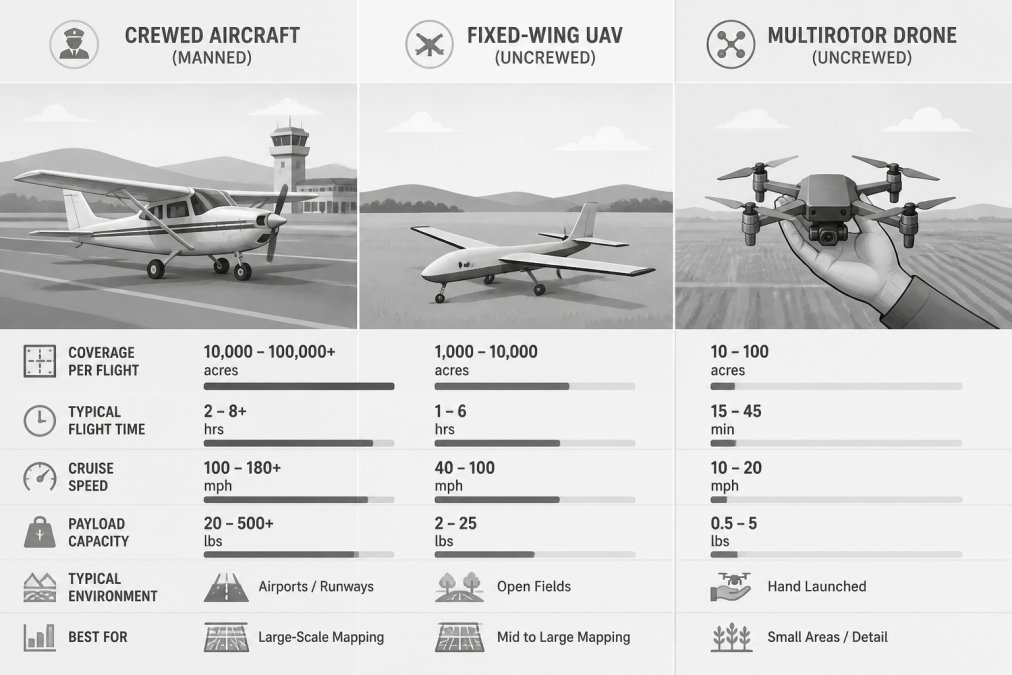
Three platforms compete for agricultural mapping: crewed fixed-wing aircraft, fixed-wing UAVs, and multirotor drones, each with different economics and operating requirements.
Crewed Fixed-Wing Aircraft (Cessna 172, Piper Cherokee, or agricultural survey services)
- Coverage: 1,000-5,000+ acres per flight
- Flight time: 2-4 hours
- Pilot requirement: FAA commercial pilot certificate with appropriate ratings
- Sensor flexibility: Limited; equipment is typically installed permanently
- Typical cost: $1,500-$3,500 per flight hour, plus aircraft rental or charter fees
- Best for: High-production agriculture (1,000+ acres), time-sensitive operations, real-time decision support
- Constraints: Requires certified airfield or suitable landing strip; weather minimums are strict; crew costs are substantial
Fixed-Wing UAVs (WingtraOne, senseFly eBee, Freefly Ranger)
- Coverage: 500-1,500 acres per flight
- Flight time: 45-120 minutes (depending on model and payload)
- Pilot requirement: FAA Part 107 remote pilot certificate
- Sensor flexibility: Good; modular payload systems allow sensor swaps between flights
- Typical cost: $25,000-$80,000 aircraft acquisition; $100-$300 per flight hour (fuel, maintenance, software)
- Best for: Large-field monitoring (300-2,000 acres), multi-field surveys in a single day, operations requiring multispectral or thermal data
- Constraints: Needs clear takeoff and landing zone (100+ feet); cannot hover or navigate obstacles; weather-dependent
Multirotor Drones (DJI Matrice 300, Freefly Astro)
- Coverage: 100-200 acres per flight
- Flight time: 20-40 minutes
- Pilot requirement: FAA Part 107 remote pilot certificate
- Sensor flexibility: Excellent; sensors swap in minutes; many models accept multiple payloads simultaneously
- Typical cost: $5,000-$25,000 aircraft acquisition; $50-$150 per flight hour (battery replacement, maintenance)
- Best for: Detailed field analysis, small parcels (under 300 acres), complex terrain, precision work requiring obstacle avoidance
- Constraints: Limited endurance; requires multiple flights for large areas; battery replacement is frequent and costly
| Metric | Crewed Aircraft | Fixed-Wing UAV | Multirotor |
|---|---|---|---|
| Per-acre cost (1,000-acre survey) | $1.50-$3.50 | $0.15-$0.30 | $0.50-$1.00 |
| Per-acre cost (100-acre survey) | $15-$35 | $0.75-$1.50 | $0.50-$1.00 |
| Setup time | 1-2 hours (scheduling, preflight) | 30-60 minutes | 15-30 minutes |
| Data turnaround | Same day (if processed on-site) | 24-48 hours | 12-24 hours |
| Regulatory overhead | High (airspace coordination, crew licensing) | Moderate (Part 107, airspace check) | Low (Part 107 only) |
| Weather tolerance | Best (can fly in light rain, lower ceilings) | Moderate (wind-sensitive, needs clear skies) | Lowest (wind, rain, low visibility problematic) |
Decision Framework
500+ acres: Fixed-wing UAVs dominate, delivering per-acre costs one-third to one-tenth that of crewed aircraft. A 1,000-acre survey costs $150-$300 and yields data within 24 hours.
1,000+ acres across multiple locations: Crewed aircraft become competitive for same-day results, though costs are $1,500-$3,500 per flight.
Under 300 acres: Multirotors are most cost-effective due to lower acquisition cost and faster setup.
Many operations use both: a fixed-wing UAV for routine large-scale monitoring and a multirotor for detailed follow-up on problem areas. This combination minimizes cost while maintaining decision speed.
Sensor Payloads: RGB, Multispectral, Thermal, and LiDAR Options
The sensor determines what data you get. RGB imagery shows visual assessment and mapping. Multispectral sensors reveal vegetation health through indices like NDVI, highlighting stressed plants. Thermal imaging shows irrigation failures by detecting heat differences. LiDAR creates precise elevation models for terrain and drainage analysis.
Fixed-wing aircraft for agricultural mapping typically carry one primary sensor per mission due to weight limits. The WingtraOne Gen II accepts sensors up to 800 grams with 59 minutes of flight time, suitable for multispectral or thermal work.
Multispectral Drone for Crop Monitoring: Vegetation Indices and Irrigation Analysis
Multispectral data transforms from abstract numbers into actionable decisions when you connect it to the specific crop question you're trying to answer.
NDVI ranges from -1 to +1, where values above 0.6 indicate healthy vegetation. However, NDVI alone doesn't reveal why a plant is stressed, low NDVI could indicate drought, nitrogen deficiency, disease, compaction, or early-season growth.
Crop-Specific Workflows
Corn (V4 to V8 growth stage): Stand Count and Replant Decisions
Multispectral imagery at V4-V8 reveals plant spacing and population. Gaps indicate failed seeds or poor germination. High-resolution orthomosaics (2-4 cm) allow you to identify replant zones and decide whether replanting is economically justified.
Corn (V10 to R1): Nitrogen Status and Variable-Rate Application
Red-edge sensors detect nitrogen status more precisely than standard NDVI. A multispectral flight at V10-V12 reveals nitrogen-deficient zones, enabling variable-rate application that reduces total nitrogen use while maintaining yield. Modern farm management systems accept these prescription maps for automatic rate adjustment.
Soybeans (R3 to R5): Disease Detection and Fungicide Timing
Fungal diseases reduce soybean yield by 10-30% if untreated. Multispectral imagery shows disease-affected leaves as lower NDVI, creating visible patches. Flying every 7-10 days from R3 onward and comparing NDVI maps week to week catches disease 3-5 days earlier than visual scouting, enabling timely fungicide application.
Wheat (Tillering to Boot): Nitrogen Timing and Yield Prediction
Multispectral data at Feekes 4-5 identifies nitrogen-deficient zones for variable-rate application. At Feekes 8-9 (flag leaf), NDVI predicts grain yield: above 0.7 suggests 50+ bushels per acre; below 0.6 suggests 35-45 bushels per acre, enabling harvest logistics and forward-selling decisions.
Alfalfa (Bloom Stage): Harvest Timing and Forage Quality
Alfalfa quality declines rapidly after bloom. Multispectral imagery shows progression to bloom through NDVI and red-edge changes. Flying every 2-3 days identifies the exact day bloom begins, enabling harvest timing that increases forage quality by 5-10 percentage points of digestibility.
Irrigation Analysis: Thermal and Multispectral Integration
Multispectral and thermal data work together to reveal irrigation efficiency. Overlay thermal and NDVI maps to identify water-stressed zones (warm and low NDVI) and well-watered zones (cool and high NDVI). Mismatch zones indicate other problems (disease, compaction, nutrient deficiency).
Data Processing and Interpretation
Multispectral data requires calibration using a reference panel to correct for atmospheric conditions and sensor drift. Without calibration, NDVI values can vary 10-20% between flights. Calibrated data is delivered as GeoTIFF files that integrate into farm management software.
Drone Mapping Flight Planning: Mission Design and Coverage Strategy
Define your survey area and required ground sampling distance (GSD). For crop monitoring, 2-4 centimeters GSD is standard; for broader assessment, 10 centimeters is adequate. A typical fixed-wing mission flies at 400 feet above ground level at 40 mph with 75% forward overlap and 60% side overlap. The software calculates flight lines and waypoints automatically.
Weather matters. Wind above 15 mph affects image quality and battery consumption. Rain and low clouds make multispectral and thermal data unreliable. The best mapping missions happen in calm, clear conditions, typically early morning or late afternoon when the sun angle is low and shadows reveal terrain.
Georeferencing, anchoring your imagery to real-world coordinates, happens two ways. RTK (Real-Time Kinematic) positioning uses ground-based correction signals to achieve centimeter-level accuracy during flight. PPK (Post-Processing Kinematic) applies corrections after the flight, which is cheaper but requires more processing time.
Accuracy, Georeferencing, and Orthomosaic Deliverables
Accuracy in agricultural mapping has two components: positional accuracy (where things are) and radiometric accuracy (what they measure).
Positional accuracy depends on your georeferencing method. RTK-equipped drones achieve 2-5 centimeter accuracy. PPK systems achieve similar accuracy but require ground control points, physical targets placed in the survey area and measured with surveying equipment. Without ground control, accuracy degrades to 10-30 centimeters depending on GPS signal quality.
For crop monitoring, 10-centimeter accuracy is usually sufficient. You're identifying field-scale patterns, not surveying individual plants. For infrastructure inspection or precision applications, centimeter-level accuracy becomes critical.
Radiometric accuracy is how faithfully your sensors measure spectral values. A multispectral sensor with poor radiometric accuracy might show vegetation stress that doesn't exist, or miss real stress. Calibration, comparing sensor output to known reference targets, ensures your data is trustworthy.
An orthomosaic is the final deliverable: a seamless, georeferenced image created by stitching hundreds of overlapping photos together. The process, called photogrammetry, reconstructs the 3D structure of the surveyed area, then projects it as a flat, overhead image. Modern photogrammetry software does this automatically, generating orthomosaics in hours.
Beyond orthomosaics, fixed-wing mapping produces digital elevation models (DEMs) and point clouds, 3D representations of terrain and vegetation. These feed into drainage analysis, erosion modeling, and crop height measurement.
Total Cost of Ownership and Operational Workflow
Fixed-wing aircraft for agricultural mapping require more upfront investment than multirotors but deliver lower per-acre cost on large surveys.
A fixed-wing VTOL drone like the WingtraOne Gen II requires purchasing the aircraft, sensors, ground station software, and processing licenses. Initial capital is substantial. A multirotor costs less to acquire but covers less area per flight, so you need more flights for the same survey.
The operational workflow determines real-world cost. For a 1,000-acre ranch:
- Fixed-wing approach: 1-2 flights, 90 minutes airtime, data processed same day
- Multirotor approach: 6-8 flights, 3-4 hours total airtime, data processed over 2-3 days
Labor cost, battery replacement, wear on equipment, and data processing time all favor fixed-wing on large acreage. On small parcels (under 100 acres), the multirotor's lower acquisition cost and faster setup win.
Operational considerations also matter. Fixed-wing aircraft need open takeoff and landing zones. If your survey area is surrounded by trees or buildings, you'll need a separate launch site, which adds logistics. Multirotors launch from anywhere flat.
Processing time varies by software and image volume. A 1,000-acre survey generates 500-1,000 images. Modern photogrammetry software processes that in 4-8 hours on standard hardware. Add multispectral processing and vegetation index calculation, and you're looking at 12-24 hours from flight to final deliverables.
Gods Eye Drone handles the entire workflow, planning, flight execution, data processing, and delivery. For agricultural clients, this means you submit your survey area, and we deliver orthomosaics and vegetation maps. That speed matters when you're making irrigation or fertilizer decisions.
Fixed-wing aircraft for agricultural mapping deliver the coverage and speed that large-scale farming demands. The question isn't whether to use them, it's whether your operation is large enough to justify the investment. For farms managing 500+ acres, the answer is almost always yes. The data you capture informs decisions that compound across seasons. Gods Eye Drone's certified pilots and state-of-the-art equipment ensure you get accurate, actionable intelligence from every flight. Book Now to discuss your mapping needs and see how aerial data can transform your operation.
Frequently Asked Questions
What are fixed-wing aircraft used for in agricultural mapping?
Fixed-wing aircraft capture wide-area imagery for crop health monitoring, irrigation planning, pest detection, and yield prediction. They collect RGB, multispectral, thermal, and LiDAR data across hundreds or thousands of acres per flight. The long endurance and range enable single-mission coverage of large farms, reducing flight time and operational cost compared to multirotor platforms. Data is processed into orthomosaics, vegetation indices, and elevation models for field-level analysis and agronomic decision-making.
Are fixed-wing drones better than multirotor drones for mapping farms?
Fixed-wing platforms excel at large-area surveys: they cover more ground per flight, fly faster, and endure longer wind. Multirotors offer precision, vertical takeoff without a runway, and flexibility in complex terrain. For farms over 100 acres, fixed-wing delivers efficiency; for smaller fields or detailed inspections, multirotors are often the better choice. The decision depends on acreage, field layout, sensor requirements, and available launch infrastructure.
How do you plan a fixed-wing drone mapping mission?
Mission planning starts with defining the survey area, desired ground sampling distance, and weather windows. Flight planning software generates a grid pattern that covers the field with sufficient overlap (typically 60-80% for photogrammetry). Operators input altitude, airspeed, and camera settings, then calculate flight time and battery or fuel needs. Ground control points are established for georeferencing, and the flight path is uploaded to the aircraft. Pre-flight checks include weather, airspace clearance, and sensor calibration.
What sensors are best for crop health analysis on fixed-wing platforms?
Multispectral sensors capture red, green, blue, red-edge, and near-infrared wavelengths, enabling calculation of vegetation indices like NDVI that correlate with crop vigor and stress. Thermal imaging detects irrigation deficiencies and disease hotspots. Hyperspectral sensors offer finer spectral resolution for advanced crop diagnostics. Payload capacity and flight time determine which sensors fit; most fixed-wing platforms carry multispectral payloads weighing 400-800 grams. Processing outputs field-level maps that guide irrigation, fertilizer, and pest management decisions.