 ultimate-guide
Multispectral Crop Analysis for Farmers: A 2026 Guide
Table of Contents
- What Is Multispectral Crop Analysis?
- How Multispectral Sensors Detect Crop Health
- NDVI Crop Monitoring: Measuring Vegetation Health
- Benefits of Drone Mapping for Small Farms
- Cost of Multispectral Drone Surveys and ROI for Farmers
- Getting Started with Multispectral Crop Analysis
- Conclusion
- Frequently Asked Questions
Last Updated: August 18, 2026
What Is Multispectral Crop Analysis?
Multispectral crop analysis captures and interprets data from multiple wavelengths of light reflected by plants to assess crop health, nutrient status, and yield potential. Unlike standard photography, multispectral imaging collects data across infrared, red, and near-infrared bands, revealing plant physiology invisible to the human eye.
Multispectral crop analysis transforms raw spectral data into actionable intelligence about nitrogen use efficiency, water stress, and disease progression. The core value lies in early detection: by the time visible symptoms appear, significant stress has already compromised yield potential. Multispectral sensors identify chlorophyll depletion, moisture stress, and pest pressure days or weeks before a farmer would notice them walking the field.
How Multispectral Sensors Detect Crop Health
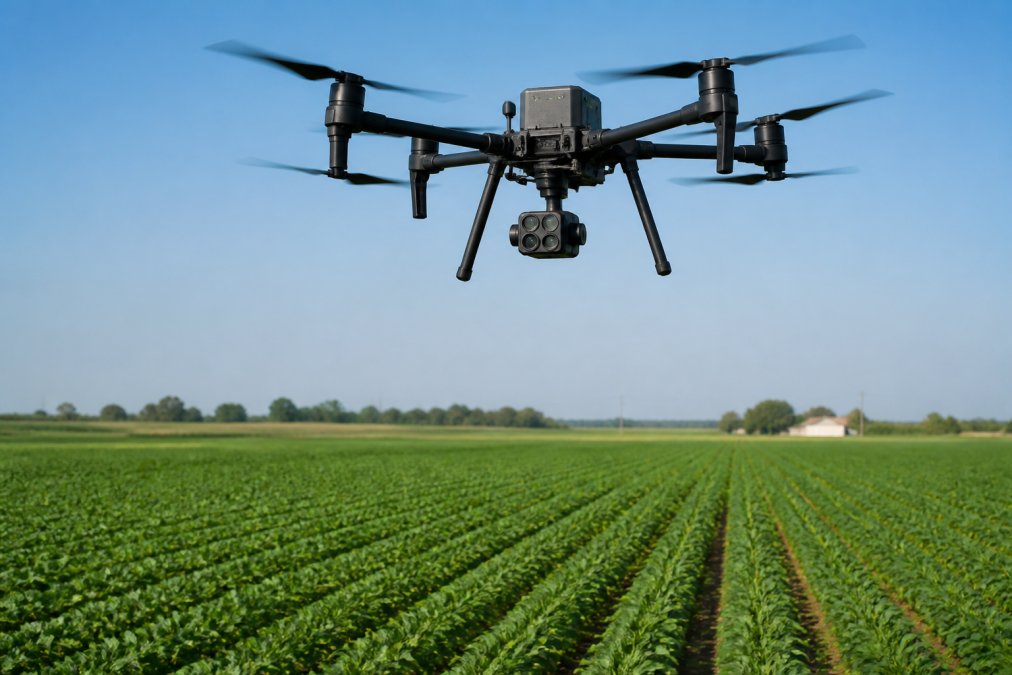
Multispectral sensors measure light intensity reflected at specific wavelengths. Healthy plants absorb red light for photosynthesis and reflect near-infrared light based on leaf structure and cellular water content. A typical agricultural multispectral camera collects information in the blue, green, red, red edge, and near-infrared bands. Each band reveals different information: red band data shows chlorophyll absorption, near-infrared reveals leaf density and water status, and red edge captures the transition zone where vegetation indices become most sensitive to plant stress.
Spectral Bands and What They Reveal
The blue band (450-495 nm) penetrates the canopy and reflects information about soil background. The green band (495-570 nm) captures chlorophyll absorption and is useful for distinguishing subtle variations in leaf pigmentation. The red band (620-750 nm) shows strong chlorophyll absorption, with healthy plants reflecting very little red light while stressed plants reflect more. The red edge (705-745 nm) sits at the inflection point between red absorption and near-infrared reflection, making it extraordinarily sensitive to changes in leaf structure and pigment content. The near-infrared band (750-1400 nm) reflects strongly from healthy leaf tissue due to internal cell structure, dropping sharply when plants experience drought stress.
Plant Stress Detection Before Visible Symptoms
A plant under nitrogen stress begins depleting chlorophyll before leaves show visible yellowing. Multispectral sensors detect this chlorophyll loss within 3-5 days of stress onset, while a farmer walking the field might not notice for another week or more. Water stress shows up in spectral data through altered reflectance patterns before wilting becomes obvious. Disease pressure alters reflectance patterns at infection sites, allowing targeted fungicide application to specific field zones rather than blanket treatment.
NDVI Crop Monitoring: Measuring Vegetation Health
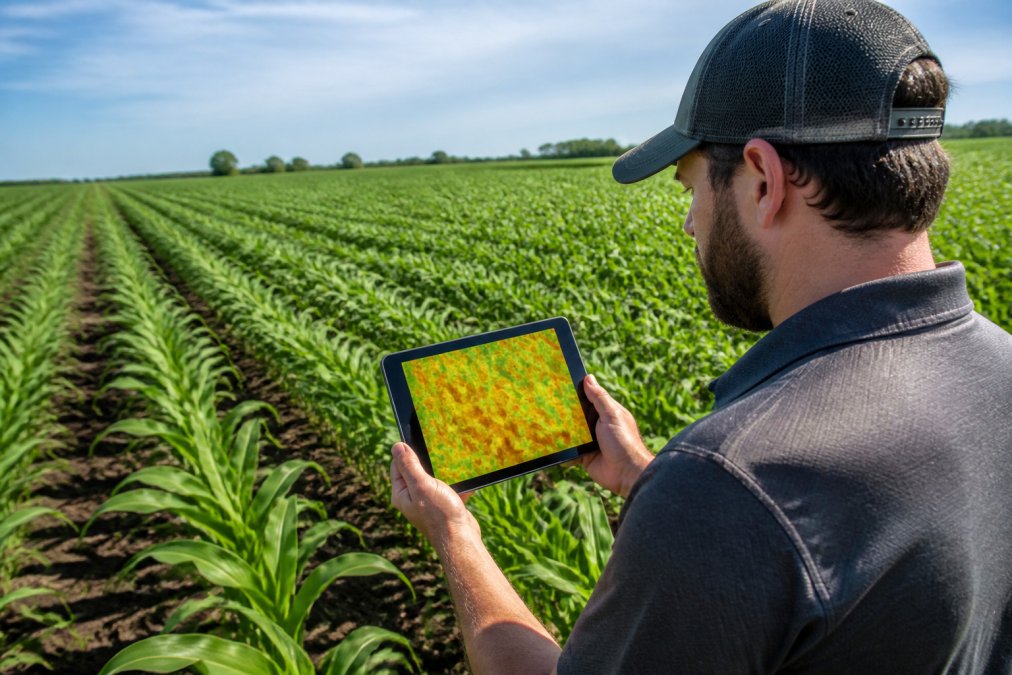
NDVI (Normalized Difference Vegetation Index) is the most widely used vegetation index in precision agriculture. It quantifies plant health on a scale from -1.0 to 1.0 by comparing red and near-infrared reflectance: NDVI = (NIR - Red) / (NIR + Red). Values above 0.6 typically indicate vigorous, healthy vegetation. Values between 0.4 and 0.6 suggest moderate vegetation or mixed plant and soil conditions. Values below 0.4 indicate sparse vegetation or stressed plants.
By mapping NDVI across the field, farmers identify problem zones with precision that walking the field cannot match. Two adjacent field sections might look equally green to the eye, but NDVI maps reveal one has consistently higher values, indicating better plant vigor or more favorable soil conditions.
Benefits of Drone Mapping for Small Farms
Drone-based multispectral crop analysis delivers precision agriculture capability at a scale that makes economic sense for small operations. A drone flight covering 100-200 acres takes 30-45 minutes and costs a fraction of what traditional aerial imagery would require. The spatial resolution of drone multispectral systems typically ranges from 0.5 to 2 cm per pixel, far exceeding satellite imagery for small fields. Drone flights can be scheduled on demand, responding to weather windows and crop growth stages, capturing fresh data within hours when conditions change daily.
Precision Input Optimization and Nitrogen Use Efficiency
Multispectral crop analysis directly informs nitrogen application decisions through variable rate technology. An NDVI map identifies zones with lower plant vigor, suggesting nitrogen deficiency or other growth-limiting factors. Rather than applying a uniform nitrogen rate across the field, a farmer applies more nitrogen to low-vigor zones and less to high-vigor zones, matching input to plant demand. A drone flight at V6 or V8 growth stage in corn, or during early pod development in soybeans, captures NDVI data that guides mid-season nitrogen decisions.
Yield Prediction and Sustainable Resource Management
Late-season multispectral crop analysis predicts yield before harvest, enabling informed decisions about harvest timing, storage planning, and market positioning. NDVI values at physiological maturity correlate with final grain fill and yield potential. Sustainable resource management relies on matching inputs to actual plant demand rather than applying blanket rates, reducing water use, nitrogen loss, and chemical inputs while maintaining or improving yields.
Cost of Multispectral Drone Surveys and ROI for Farmers
Multispectral drone surveys generate ROI through reduced input waste, earlier stress detection that prevents yield loss, and improved decision-making based on spatial data. Conservative estimates suggest multispectral crop analysis breaks even when applied to 80-120 acres of high-value crops.
Evaluating Return on Investment
To evaluate ROI for your operation, identify the highest-value decisions your current scouting method informs poorly. Document baseline yield, input costs, and scouting time before implementing multispectral crop analysis. Measure the same metrics after adopting the practice for at least two seasons, accounting for weather and market changes. Start small by flying a portion of your operation first, compare results to adjacent unflown areas, and expand only if you see measurable improvement.
Integration with Farm Management Software
Most modern farm management software platforms integrate multispectral data through standard file formats and geospatial APIs. NDVI maps export as GeoTIFF files that load directly into mapping platforms like Trimble, John Deere Operations Center, or AgWorld. Variable rate application files generated from multispectral data export as standard prescription maps compatible with most modern applicators.
Getting Started with Multispectral Crop Analysis
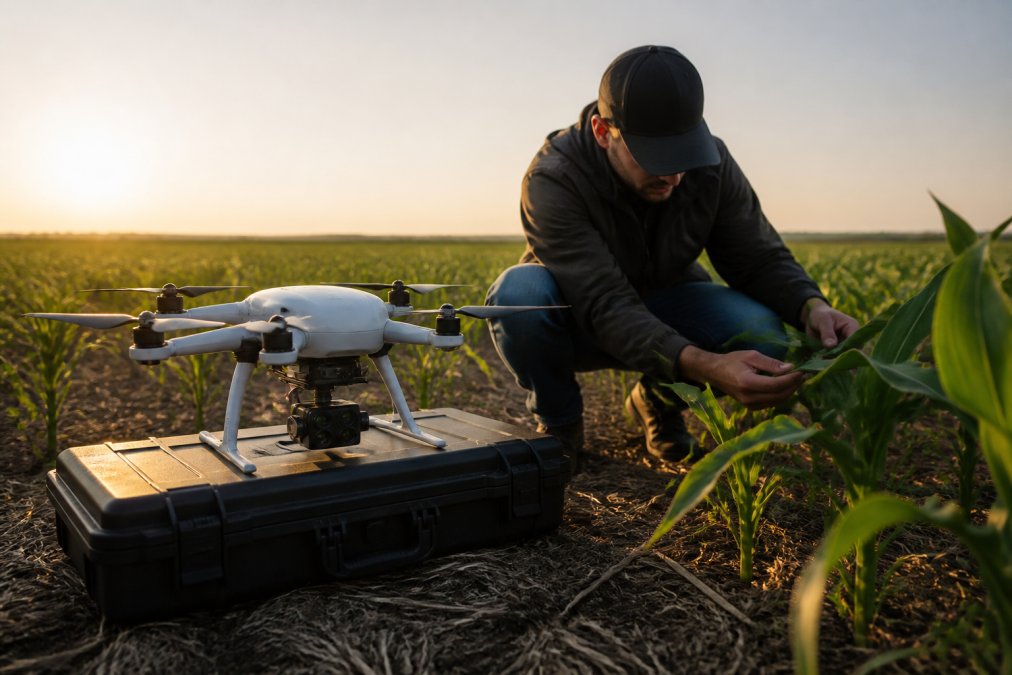
For most small to mid-sized operations, outsourcing to a professional service provider like Gods Eye Drone makes economic sense, eliminating equipment cost and training requirements while providing expert data interpretation. Select a provider with proven experience in agricultural multispectral imaging and certified pilots. Request sample deliverables from similar operations to evaluate data quality and interpretation support.
If you're considering equipment ownership, understand the full cost picture. A quality agricultural multispectral camera, ground control points, calibration panels, post-processing software, training, and ongoing maintenance add up quickly. Equipment ownership makes sense only if you have sufficient acreage and flight frequency to justify the investment.
Flight Planning and Data Collection
Successful multispectral crop analysis begins with careful flight planning. Lower altitudes (100-150 feet above ground level) capture finer detail but require more flight time. Higher altitudes (300-400 feet) cover more ground per flight but sacrifice spatial resolution. Mid-morning flights between 10 AM and 2 PM, when the sun is highest and shadows are shortest, produce the most consistent multispectral data. Cloud cover should be minimal, ideally less than 10 percent.
Ground control points (GCPs) improve geospatial accuracy. These marked targets of known GPS location and reflectance properties are placed strategically across the flight area before the drone launches. A typical flight plan includes 8-12 GCPs for fields up to 200 acres. Calibration panels are white, gray, and black reference targets used during image processing to correct for atmospheric and sensor effects.
Technical Skills and Hardware Maintenance
Operating a multispectral drone system requires familiarity with flight planning software, understanding of basic photogrammetry concepts, and ability to troubleshoot equipment issues. Hardware maintenance is non-negotiable for consistent multispectral crop analysis. Clean the sensor lens before and after each flight and store equipment in climate-controlled conditions. Have the sensor professionally calibrated annually or after any impact or environmental exposure. Battery management affects data quality, use fresh batteries for each flight and replace them according to manufacturer specifications.
Conclusion
Multispectral crop analysis transforms how farmers understand field variability and make input decisions. By capturing data across multiple spectral bands, this technology detects plant stress, quantifies vegetation health through indices like NDVI, and enables precision agriculture practices that improve yields while optimizing resource use. For small to mid-sized operations, outsourcing drone flights to a certified service provider like Gods Eye Drone provides access to this capability without significant capital investment. Start with a single flight covering your highest-value acreage, compare the spatial data to your current scouting methods, and expand only if the insights justify the cost. Get started today with Gods Eye Drone and unlock the precision intelligence that drives data-driven farming decisions.
Frequently Asked Questions
What is multispectral crop analysis and how does it differ from regular drone photography?
Multispectral crop analysis uses specialized sensors that capture data across multiple wavelengths of light, including infrared and red-edge bands invisible to the human eye. Unlike standard RGB photography, multispectral imaging reveals plant health, chlorophyll content, and stress indicators before they become visible. This allows farmers to identify nitrogen deficiencies, water stress, and disease pressure early enough to take corrective action.
How does NDVI crop monitoring help improve farm decisions?
NDVI (Normalized Difference Vegetation Index) quantifies plant vigor by comparing near-infrared and red light reflectance. Higher NDVI values indicate healthier vegetation. Farmers use NDVI maps to identify underperforming zones within fields, apply variable rate fertilizer or irrigation only where needed, and predict yield before harvest. This targeted approach reduces input costs while maximizing productivity on every acre.
What is the typical cost of multispectral drone surveys, and how long does ROI take?
The cost of multispectral drone surveys depends on field size, flight frequency, and data processing complexity. Pricing varies significantly by provider and region. To determine your return on investment, calculate input savings from precision application, yield improvements from early stress detection, and reduced scouting labor. Many farmers see positive ROI within the first season if they manage 500+ acres or apply variable rate inputs. Contact your drone service provider for a customized cost-benefit analysis based on your specific operation.
Can small-scale farms afford multispectral crop analysis?
Small farms can benefit from multispectral analysis, but economics depend on acreage and crop value. Operations managing 200-300+ acres of high-value crops (corn, soybeans, specialty vegetables) typically justify the investment. For smaller operations, consider sharing flight costs with neighboring farms, starting with a single field to test results, or using satellite-based multispectral data as a lower-cost entry point. Working with an experienced drone service provider helps identify which fields offer the highest ROI potential.
How often should farmers conduct multispectral drone flights during the growing season?
Flight frequency depends on crop stage and management goals. Most farmers benefit from 3-4 flights per season: early season (V4-V6 corn growth stage) to assess emergence and early vigor, mid-season (V10-V14) to detect nutrient stress before yield impact, late season (R3-R5) to predict yield and plan harvest logistics, and post-season to evaluate field performance. More frequent flights help catch stress events faster, while fewer flights reduce costs. Your agronomist and drone provider can recommend an optimal schedule for your specific crops and goals.
What plant health indicators can multispectral sensors detect?
Multispectral sensors detect chlorophyll content (indicating nitrogen availability), canopy water stress, disease pressure (fungal infections often show spectral signatures before visible symptoms), pest damage, and soil variability effects on plant growth. Red-edge wavelengths are particularly sensitive to chlorophyll changes, allowing detection of nitrogen deficiency 1-2 weeks before visual symptoms appear. Near-infrared bands reveal overall biomass and canopy density, helping predict yield potential and identify problem areas for targeted scouting.
How does multispectral data integrate with farm management software?
Most modern farm management software platforms accept multispectral imagery and vegetation index maps as inputs. Integration workflows typically involve uploading processed NDVI or other vegetation indices to your FMS, which then triggers variable rate application maps for the next operation. Some providers offer direct API connections for seamless data flow. Before choosing a drone service, verify that their data format and processing methods are compatible with your existing farm management system to ensure smooth workflow integration.
[EXTERNAL_LINK: USDA's precision agriculture resources | usda.gov]
[EXTERNAL_LINK: American Society of Agronomy guidance on crop monitoring | agronomy.org]
[EXTERNAL_LINK: Purdue University's multispectral imaging research for agriculture | purdue.edu]
This article was written using GrandRanker