 how-to
How to Optimize Corn Yield with Multispectral Drone Imaging
Table of Contents
- What You'll Need Before Your First Flight
- Step 1: Choose the Best Multispectral Drone Cameras for Agriculture
- Step 2: Plan Your Flight for Accurate Multispectral Data
- Step 3: Drone Crop Scouting Best Practices for In-Season Monitoring
- Step 4: NDVI vs NDRE for Corn Health: Which Index to Use and When
- Step 5: Process Imagery and Map Field-Scale Variability
- Step 6: Integrate Data with Variable Rate Technology and Nitrogen Management
- Common Mistakes and Troubleshooting Flight Errors
- Frequently Asked Questions
Last Updated: September 13, 2026
What You'll Need Before Your First Flight
Multispectral drone imaging is the practice of capturing light reflectance across multiple specific wavelengths, including near-infrared and red-edge bands, to assess crop health beyond what the human eye can see. For corn growers, it turns a field from a uniform green block into a map of corn yield variability.
At Gods Eye Drone, our certified pilots use multispectral sensors to help agricultural managers identify stress zones, water variability, and nitrogen deficiencies before they become visible. Before your first flight, you need four things:
- A multispectral sensor with at least red, red-edge, and near-infrared bands
- A flight planning app that supports automated grid missions
- Ground control points or RTK positioning for accurate orthomosaic stitching
- A processing platform that outputs vegetation indices and field-scale maps
The equipment list is short. The planning that follows is where most growers lose accuracy.
Step 1: Choose the Best Multispectral Drone Cameras for Agriculture
The best multispectral drone cameras for agriculture balance spectral resolution, spatial resolution, and price. For corn, you need sensors that capture red-edge bands, not just standard RGB and NDVI.
Sensor Resolution and Band Selection
Spatial resolution determines how small a stress patch you can detect. A sensor with a 3-5 cm/pixel ground sampling distance (GSD) at your target flight altitude will resolve individual plants. Lower resolution (10 cm+) blurs rows together and hides early stress.
Band selection matters more than megapixels. Corn responds strongly to red-edge and near-infrared reflectance. Sensors that skip red-edge cannot calculate NDRE, which is the index that catches nitrogen stress before NDVI does.
Hardware ROI: What You Actually Get Back
Most growers ask whether a multispectral setup pays for itself. The honest answer: it depends on how you use the data. A sensor that only produces pretty NDVI maps is a cost. A sensor that feeds variable rate prescriptions is an investment.
The ROI comes from three places: reduced blanket nitrogen applications, earlier detection of stress that would otherwise cost corn yield, and better placement of irrigation. Growers who act on the maps, not just generate them, see the return.
USDA precision agriculture guidance
Step 2: Plan Your Flight for Accurate Multispectral Data
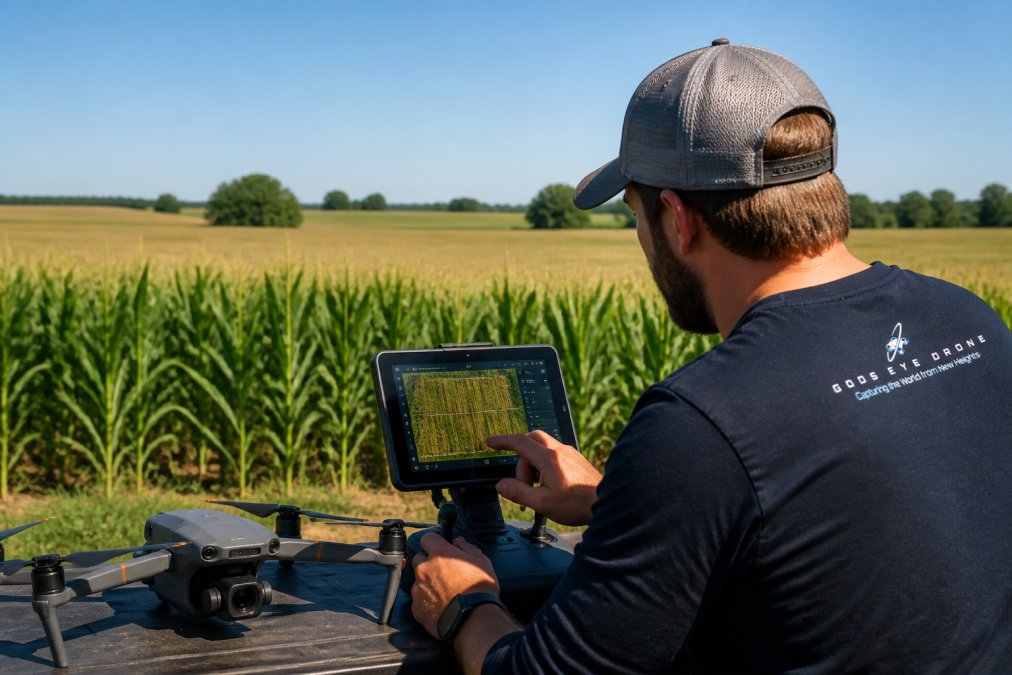
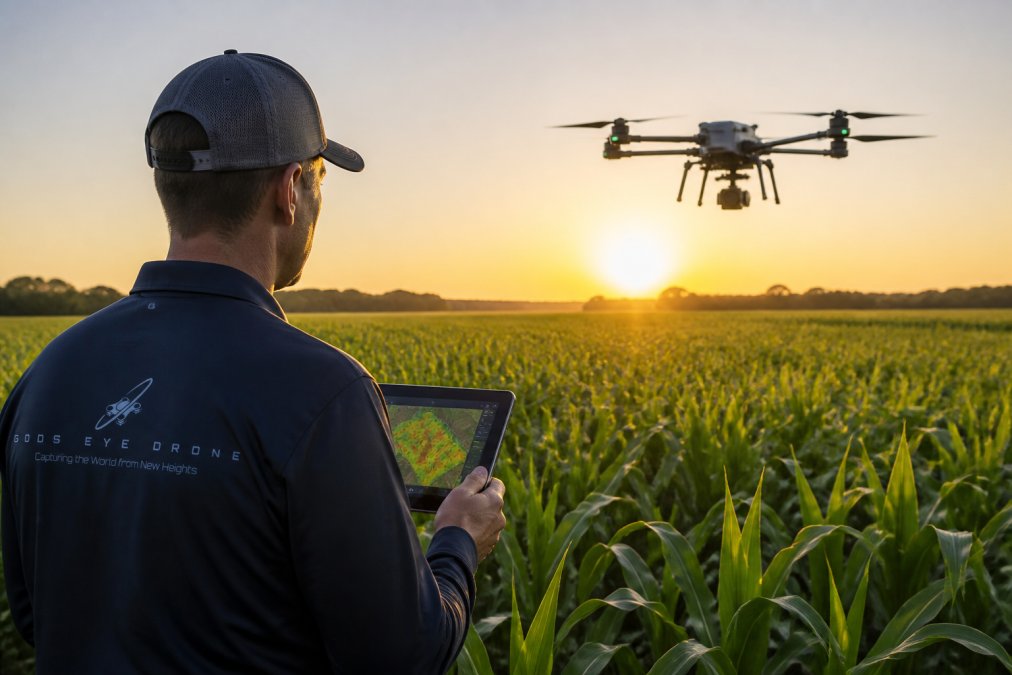
Accurate multispectral data starts with disciplined flight planning. Altitude, overlap, time of day, and calibration all determine whether your maps are trustworthy.
Altitude, Ground Sampling Distance, and Overlap
Lower altitude means finer GSD but more flight lines and longer missions. A common approach is to set altitude so GSD lands between 3 and 5 cm/pixel for in-season scouting, and slightly coarser for whole-field mapping.
Overlap is non-negotiable. Aim for 75-80% forward overlap and 65-70% side overlap. Underlap produces gaps in the orthomosaic, and gaps force interpolation that invents data you don't have.
Regulatory and Legal Flight Planning for Agriculture
In the United States, commercial drone operations fall under FAA Part 107 rules (faa.gov). That means a certified remote pilot, registration for the aircraft, and adherence to altitude and airspace limits. Agricultural operations near airports or restricted zones require coordination through the FAA's airspace authorization process.
Beyond the FAA, check state and local rules on spraying, data privacy, and any easements on the land you're flying over. A certified pilot who knows the airspace saves you from grounded missions and fines.
Step 3: Drone Crop Scouting Best Practices for In-Season Monitoring
Drone crop scouting best practices come down to timing and consistency. Fly the same fields, at the same growth stages, with the same sensor settings, so your temporal data is comparable.
Key practices:
- Fly during mid-morning or under consistent cloud cover to reduce shadow and sun-angle error
- Capture a calibration panel image before and after each flight
- Scout the same waypoints each week to build a reliable time series
- Ground-truth anomalies on foot before acting on them
The single biggest mistake is flying once, seeing a red patch, and assuming it's a problem. A red patch could be a soil change, a drainage issue, or a shadow. Ground-truthing separates signal from noise.
Step 4: NDVI vs NDRE for Corn Health: Which Index to Use and When
NDVI vs NDRE for corn health is not a competition; they answer different questions at different growth stages. NDVI is sensitive to overall biomass and canopy greenness. NDRE penetrates deeper into the canopy and catches nitrogen stress earlier.
Use NDVI for early-season vigor and canopy establishment. Switch to NDRE once the canopy closes, typically around V8 to VT, because NDVI saturates in dense corn and stops distinguishing healthy from stressed plants.
Vegetation Indices for Specific Growth Stages
| Growth Stage | Best Index | What It Reveals |
|---|---|---|
| Emergence to V6 | NDVI | Stand uniformity, early vigor |
| V6 to V10 | NDRE | Early nitrogen stress |
| V10 to VT | NDRE | Canopy nitrogen status |
| VT to R3 | NDRE, GNDVI | Water stress, grain fill potential |
GNDVI is a useful backup when NDVI saturates, and it correlates well with chlorophyll content during grain fill.
Step 5: Process Imagery and Map Field-Scale Variability
Processing turns raw images into field-scale variability maps. The workflow is: stitch the orthomosaic, apply radiometric correction, calculate vegetation indices, and export zone maps.
Two settings decide map quality. First, radiometric correction, which normalizes reflectance so data is comparable across flights. Second, resolution, which should match your management zones. There's no point mapping at 2 cm/pixel if your variable rate controller works in 10-meter zones.
Export your maps as shapefiles or prescriptions your ag software can read. A beautiful map that lives only in a dashboard changes nothing.
Step 6: Integrate Data with Variable Rate Technology and Nitrogen Management
Integration with variable rate technology (VRT) is where multispectral data earns its keep, and it is the step most articles skip. VRT lets you apply seed, fertilizer, and water at different rates across a field based on your zone maps. The gap between a pretty NDRE map and a prescription your spreader can actually read is where yield gets won or lost.
From Zone Map to Prescription File
The workflow that works on commercial corn acres looks like this:
- Export zones as a shapefile or GeoJSON. Most ag software (Climate FieldView, John Deere Operations Center, Trimble Ag Software, SMS Advanced) accepts shapefiles, and many now accept ISOXML or a native prescription format.
- Assign a rate to each zone. A five-zone NDRE map might translate to 0, 40, 80, 120, and 160 lb N/acre. Keep the zone count at or below what your controller and applicator can physically vary, five to seven zones is a common ceiling.
- Convert to the controller's format. Deere controllers want a Deere prescription (.rx), Trimble wants a Trimble format, and Ag Leader SMS can export to most. Your ag retailer or co-op usually handles this conversion if you don't.
- Load and verify. Load the prescription, drive a test pass, and confirm the controller is actually changing rate at zone boundaries before you fill the tender.
- Apply, then re-fly. The re-flight is what most growers skip. Without it, you never learn whether your prescription worked or whether you left yield on the table.
Nitrogen Rate Math That Holds Up
A common pattern is to anchor the prescription to a base rate from your yield goal and a realistic nitrogen-use efficiency, then let the NDRE zones shift that base up or down. For example, if your base is 180 lb N/acre and your NDRE map shows three zones, you might set the low-vigor zone at 140, the mid zone at 180, and the high-vigor zone at 210. The point is not the exact numbers, it is that the map drives the delta, not a flat blanket rate.
Two cautions. First, corn's nitrogen response is not linear; pushing the high-vigor zone too hard is a common way to lose money. Second, sidedress timing matters more than zone precision. A perfect prescription applied at V12 beats a rough one applied at V6.
Where the ROI Actually Comes From
The return on a multispectral-plus-VRT program comes from three places: reduced blanket nitrogen applications, earlier detection of stress that would otherwise cost yield, and better placement of irrigation. Growers who act on the maps, not just generate them, see the return. A sensor that only produces pretty NDVI maps is a cost. A sensor that feeds variable rate prescriptions is an investment.
USDA precision agriculture guidance
Common Mistakes and Troubleshooting Flight Errors
The most common flight errors are predictable, and almost all of them trace back to mission planning rather than the sensor. Here is a diagnostic sequence that separates a hardware problem from a planning problem.
Symptom: Gappy or Blurry Orthomosaic
Likely cause: too little overlap or too fast a shutter speed.
Fix: Raise forward overlap to 75-80% and side overlap to 65-70%. If gaps persist, slow the drone or raise altitude slightly so the camera has time to trigger between waypoints. Motion blur at low altitude is usually a shutter-speed issue, most multispectral sensors want a shutter fast enough to freeze the aircraft's ground speed, which often means flying slower rather than changing camera settings.
Symptom: Maps Look Different Every Flight
Likely cause: missing or inconsistent radiometric calibration.
Fix: Capture a calibration panel image before and after every flight, and process with the same radiometric correction settings each time. Without it, a change in cloud cover looks like a change in crop health, and you'll chase problems that don't exist. This is the single most common reason two flights of the same field disagree.
Symptom: Shadows Read as Stress
Likely cause: flying at midday in harsh sun.
Fix: Fly mid-morning or under consistent, thin cloud cover. Shadows cast by clouds, equipment, or terrain create dark patches that vegetation indices interpret as low vigor. If you must fly in variable light, note it in your field log so you don't misread the map later.
Symptom: Reflectance Values Are Meaningless
Likely cause: forgotten calibration panel or a panel that was in shadow.
Fix: The panel must be in full sun, flat, and free of debris. Re-shoot the panel if conditions change mid-flight. A panel shot in shadow produces reflectance values that are worse than no calibration at all, because they look plausible.
Symptom: Map Resolution Finer Than You Can Use
Likely cause: processing at 2 cm/pixel when your management zones are 10 meters.
Fix: Match processing resolution to your management zones and controller capability. There is no point mapping at 2 cm/pixel if your variable rate controller works in 10-meter zones, you are paying for data you cannot act on.
Symptom: One Red Patch, One Panic
Likely cause: acting on a single flight instead of building a time series.
Fix: Ground-truth anomalies on foot before acting on them. A red patch could be a soil change, a drainage issue, or a shadow. A time series separates signal from noise; a single flight does not.
Frequently Asked Questions
What is the best multispectral sensor for corn crop monitoring?
The best sensor depends on your goals. For general crop scouting and NDVI, a 5-band sensor covering Red, Green, Blue, Red Edge, and Near-Infrared is standard. For advanced research or detecting specific nutrient deficiencies, a 10-band sensor provides more detail. Key specs to check are spatial resolution, spectral bandwidth, and whether the sensor includes a radiometric calibration panel for accurate data.
When is the best time to fly multispectral drones over corn fields?
Fly during critical growth stages when the crop is most responsive to management. Key windows are V6 to V10 for nitrogen assessment, tasseling (VT) for stress detection, and milk to dough stages for yield estimation. Fly on clear days between 10 a.m. and 2 p.m. to ensure consistent sunlight and minimize shadows. Avoid flying immediately after rain or in high winds to prevent data distortion.
How can drone data improve nitrogen management in corn?
Multispectral imagery uses vegetation indices like NDVI and NDRE to identify areas of the field with low chlorophyll content, which often indicates nitrogen deficiency. This allows you to create variable rate application maps that apply nitrogen only where it's needed. This targeted approach can reduce input costs, prevent over-application, and improve overall crop health and yield potential.
How do I know if my drone data is accurate enough for decision-making?
Accuracy depends on proper calibration and processing. Always use a radiometric calibration panel before each flight to account for light variations. Ensure your ground sampling distance (GSD) is sufficient for your crop stage, typically 2-5 cm per pixel for early season and 5-10 cm for later stages. Ground-truth your data by comparing map zones to physical crop scouting observations to validate findings.
Corn yield optimization rewards growers who act on data consistently, not those who collect it once. Gods Eye Drone provides multispectral imaging, aerial environmental intelligence, and certified pilots who understand both the airspace and the agronomy behind the maps. Our team delivers precise aerial inspections and field-scale data you can feed straight into your VRT and nitrogen planning. Book Now with Gods Eye Drone and turn your fields into decisions.