 how-to
Multispectral Agricultural Drone Imaging: Benefits & How-To
Table of Contents
- What Is Multispectral Agricultural Drone Imaging
- How Multispectral Sensors Detect Crop Health and Plant Stress
- NDVI Crop Health Analysis for Precision Decision-Making
- Variable Rate Application Mapping and Input Optimization
- Agricultural Drone Data Processing Software Workflow
- Calculating ROI of Multispectral Drone Imaging for Your Operation
- Flight Planning, Regulatory Compliance, and Data Troubleshooting
- Getting Started with Multispectral Agricultural Drone Imaging
- Frequently Asked Questions
Last Updated: August 19, 2026
What Is Multispectral Agricultural Drone Imaging
Multispectral agricultural drone imaging captures multiple wavelengths of light across crop fields using specialized sensors on unmanned aerial vehicles. Unlike standard RGB photography, multispectral sensors record data across specific spectral bands, near-infrared, red, red edge, and visible light, to create detailed maps of crop health and field variability.
A drone equipped with a multispectral camera surveys hundreds of acres in a single flight, collecting information about vegetation indices, biomass, and plant stress indicators invisible to the naked eye. The resulting field maps guide precision agriculture decisions: where to apply variable input rates, which areas need irrigation adjustments, and which zones show early pest or disease pressure.
Gods Eye Drone integrates multispectral imaging into its full-service agricultural consulting, helping farmers move beyond guesswork toward data-driven field management. The technology reveals hidden patterns in crop performance that drive yield optimization and input efficiency.
How Multispectral Sensors Detect Crop Health and Plant Stress
Understanding Spectral Bands and NDVI
Multispectral sensors isolate specific wavelengths of light reflected by plants and soil. The red band captures light absorbed by chlorophyll, while the near-infrared band reflects strongly from healthy vegetation. The red edge band, positioned between red and near-infrared, is particularly sensitive to changes in chlorophyll content and leaf structure.
These bands combine into vegetation indices, most commonly NDVI (Normalized Difference Vegetation Index). NDVI is calculated as (NIR - Red) / (NIR + Red), producing a value between -1 and 1 that quantifies vegetation vigor. Healthy, dense vegetation produces NDVI values near 0.7 to 0.9. Stressed plants show 0.4 to 0.6, while bare soil approaches zero. This single metric becomes the foundation for field mapping and decision-making.
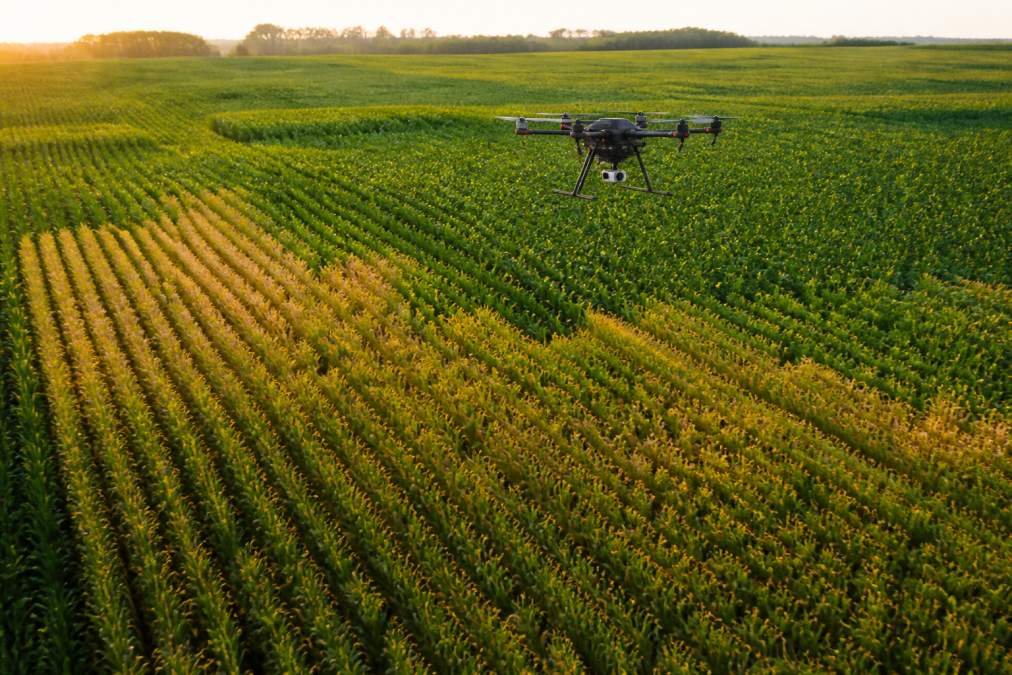
Multispectral data detects physiological stress days or weeks before visual symptoms appear. A plant under water stress or nutrient deficiency shows measurable changes in spectral reflectance before leaves visibly wilt. This early warning window is where precision agriculture creates real economic value.
Early Detection of Crop Stress Before Visual Symptoms
Plant stress manifests in spectral reflectance long before becoming visible. Corn experiencing early-stage nitrogen deficiency shows reduced chlorophyll content, which decreases near-infrared reflectance and lowers NDVI values. Multispectral imagery captures this shift, pinpointing affected zones while the crop still has time to respond to corrective action.
The same principle applies to water stress, disease, and pest damage. Diseased leaves reflect light differently than healthy ones. Compacted soil zones, which restrict root development, create stress patterns visible in multispectral data before above-ground symptoms appear. Catching a nitrogen deficiency in V4 corn allows a corrective sidedress application; catching it at V10 means accepting yield loss.
Early detection also reduces input waste. Rather than applying preventive fungicide across an entire field, multispectral data identifies specific zones where disease pressure is developing. Irrigation can be adjusted to match actual soil moisture and plant water demand.
NDVI Crop Health Analysis for Precision Decision-Making
NDVI crop health analysis transforms multispectral data into field management decisions. After a drone flight, raw spectral data is processed into a georeferenced NDVI map showing vegetation vigor across every part of the field. Green zones indicate healthy growth. Yellow and orange zones flag stress areas requiring investigation or intervention.
The practical workflow is straightforward: identify low-NDVI zones, investigate the cause (soil texture, compaction, drainage, pest pressure, nutrient deficiency), and decide on corrective action. The NDVI map prevents treating the entire field when only 15 percent needs attention.
Temporal NDVI analysis, comparing maps from multiple flights across a growing season, reveals trends. A zone showing consistent low NDVI from V4 through V8 likely has a persistent soil or drainage issue. A zone dropping sharply between flights might indicate pest damage or disease onset.
Variable Rate Application Mapping and Input Optimization
Variable rate application (VRA) mapping uses multispectral data to create prescription maps for fertilizer, fungicide, herbicide, and other inputs. Instead of applying uniform rates, VRA matches input intensity to actual plant need and field condition.
Low-vigor zones receive higher nitrogen rates to stimulate growth. High-vigor zones receive lower rates, avoiding excess vegetative growth that delays maturity and invites disease. Disease-pressure zones receive targeted fungicide applications. Weed-pressure zones receive higher herbicide rates.
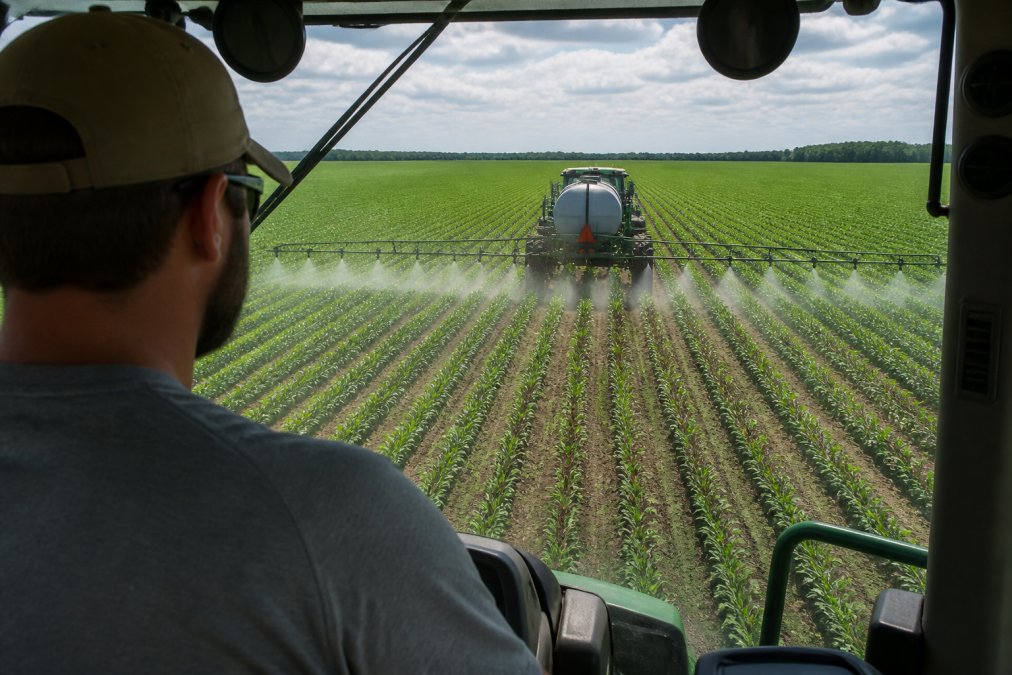
A field historically receiving 150 pounds of nitrogen per acre uniformly might need only 120 pounds on average, with high-vigor zones receiving 100 pounds and low-vigor zones receiving 160 pounds. That 20-percent reduction in average rate, applied across hundreds of acres, represents meaningful savings while improving crop performance in previously under-fertilized zones.
VRA also reduces environmental impact. Excess fertilizer running off into waterways creates regulatory compliance issues. Precision application keeps nutrients where they're needed, in the crop and soil.
Agricultural Drone Data Processing Software Workflow
From Raw Imagery to Actionable Field Maps
Raw multispectral imagery from a drone requires processing before use. A typical flight captures thousands of individual images across multiple spectral bands. These raw files must be stitched into a seamless orthomosaic, radiometrically calibrated to account for lighting and atmospheric variation, georeferenced to match real-world coordinates, and processed into vegetation indices and prescription maps.
The data processing pipeline runs through specialized agricultural software. Raw images are uploaded, aligned into a seamless mosaic, radiometrically calibrated, and processed into vegetation indices. The output is a georeferenced NDVI map and other layers ready for field decision-making.
Gods Eye Drone handles this processing as part of its service, delivering finished field maps and analysis rather than raw data files. For operations managing multispectral imaging in-house, reliable processing software is essential; poor processing produces misleading maps and bad decisions.
Georeferencing, Radiometric Calibration, and Ground Truthing
Georeferencing anchors imagery to real-world coordinates using GPS data from the drone and ground control points, markers placed on the field before flight and measured with survey-grade GPS. Without accurate georeferencing, field maps don't align with actual field boundaries, and prescription maps won't apply inputs to the correct zones.
Radiometric calibration corrects for lighting variation across the flight. Early-morning and late-afternoon light angles differ from midday light. Clouds create shadows. A radiometric correction factor ensures NDVI values are comparable across the entire image and across multiple flights on different days.
Ground truthing validates the data. Walk low-NDVI zones and confirm stress actually exists. A low-NDVI reading might indicate a soil type change, not plant stress. Spending an hour ground truthing prevents expensive mistakes based on misinterpreted data.
Calculating ROI of Multispectral Drone Imaging for Your Operation
ROI depends on field size, input costs, and the magnitude of yield or input-efficiency gains. A 100-acre field where VRA reduces nitrogen application by 15 percent generates real savings. A 500-acre operation sees those savings multiplied. Very small operations (under 50 acres) may struggle to justify the cost unless the field has significant variability.
A 300-acre corn field with nitrogen costing $50 per acre, reduced by 15 percent through VRA, saves $2,250 per season. Multispectral imaging services typically cost $3 to $10 per acre, or $900 to $3,000 for 300 acres. Payback occurs within a single season for many operations.
Yield improvements add to the return. Correcting nutrient deficiencies, detecting and managing disease early, and optimizing irrigation often improve yields by 2-5 percent. A 2-percent yield gain on 300 acres represents significant additional revenue.
The strongest ROI cases involve fields with documented variability: historically inconsistent yields, visible stress zones, drainage issues, or soil texture variation. Start with your most variable fields and expand from there.
Flight Planning, Regulatory Compliance, and Data Troubleshooting
FAA Regulations and Flight Authorization
Multispectral drone flights are subject to Federal Aviation Administration (FAA) regulations governing unmanned aircraft operations. Commercial drone operations require a Part 107 remote pilot certificate, which mandates passing a knowledge test and demonstrating safe operating practices. The certificate holder is responsible for safe flight operations, airspace compliance, and documentation.
Part 107 rules require visual line-of-sight (VLOS) operation, flights cannot exceed 400 feet above ground level, and operations near airports, over people, or in controlled airspace require specific authorization. Weather conditions impose operational limits.
Many agricultural operations qualify for specific exemptions under Part 107 waivers. Working with a certified operator like Gods Eye Drone ensures compliance with current regulations and authorization requirements.
Common Data Errors and How to Prevent Them
Multispectral data processing introduces several common failure modes: misalignment during orthomosaic stitching, poor radiometric calibration producing inconsistent NDVI values, GPS drift creating georeferencing errors, and incorrect calibration targets introducing systematic bias.
Preventing these errors begins with flight planning. Fly in consistent lighting conditions (midday, clear skies) to simplify radiometric calibration. Use ground control points to anchor georeferencing. Calibrate the sensor using a white reference panel at the start of each flight.
Data validation is critical. Compare processed NDVI maps against visual field observations. Walk low-NDVI zones and confirm stress exists. Check that field boundaries align correctly on the georeferenced map.
Getting Started with Multispectral Agricultural Drone Imaging
Starting with multispectral agricultural drone imaging involves three basic paths: hire a service provider, lease equipment, or purchase and operate your own system.
Hiring a service provider is the lowest-barrier entry point. A certified operator conducts flights, processes data, and delivers finished field maps. Service costs typically range from $3 to $10 per acre. This path requires no capital investment, no regulatory compliance burden, and no technical expertise.
Leasing equipment allows greater control and flexibility. Seasonal drone rental with processing software typically runs $1,000 to $3,000 per month plus operational expenses.
Purchasing equipment requires capital investment ($10,000 to $50,000+ for a quality multispectral system) and either obtaining your own Part 107 certification or hiring a certified pilot. This path makes economic sense for large operations (1,000+ acres) or service providers offering imaging to other farms.
Regardless of path, start with a single season of baseline data. Conduct flights at key growth stages (V4-V6, VT, R1-R2 for corn). Process data into NDVI maps and compare against field observations. Identify zones of consistent stress or variability. Use that information to guide input decisions in year two.
Gods Eye Drone supports all three paths: as a service provider conducting flights and analysis, as a data processing partner for operations managing their own flights, and as a consultant helping farms evaluate equipment investment and develop multispectral imaging workflows. The goal is moving from guesswork to data-driven precision agriculture decisions that improve yields, reduce input costs, and build long-term field resilience.
Multispectral agricultural drone imaging transforms how you understand and manage field variability. The data reveals stress patterns invisible to the eye, guides precision input application, and creates measurable returns through yield improvement and input efficiency. Working with an experienced service provider like Gods Eye Drone lets you test the technology, validate the benefits, and build confidence before expanding your program. Book a consultation to discuss how multispectral imaging can improve decision-making across your operation.
Frequently Asked Questions
How does multispectral agricultural drone imaging detect plant stress before I can see it with my eyes?
Multispectral sensors capture light across multiple spectral bands, including near-infrared wavelengths invisible to the human eye. Healthy plants reflect significant near-infrared light; stressed plants reflect less. NDVI calculations compare red and near-infrared reflectance to quantify crop health days or weeks before visual symptoms appear. This early detection allows you to intervene with irrigation, nutrients, or pest management before yield loss occurs, making it a critical tool in precision agriculture.
What is NDVI crop health analysis and how do I use it in my operation?
NDVI (Normalized Difference Vegetation Index) is a mathematical calculation that measures vegetation vigor by comparing red and near-infrared spectral bands. Higher NDVI values indicate healthier, more vigorous plants; lower values signal stress or poor growth. After multispectral drone flights, NDVI maps highlight field variability in color-coded zones. Agronomists use these maps to identify underperforming areas, guide variable rate application of inputs, and adjust irrigation zones. Ground truthing (field validation) confirms what NDVI shows, refining your agronomic strategy.
How much can I save by using multispectral drone imaging instead of guessing about crop conditions?
ROI depends on field size, input costs, and current yield losses. Typical benefits include 5-15% reduction in fertilizer and pesticide waste through variable rate application, 10-20% water savings from optimized irrigation, and yield increases of 3-8% from earlier stress detection. On a 500-acre operation with $200-300 per-acre input costs, eliminating just 10% waste across the season can offset drone imaging costs. Calculate your ROI by estimating current input spending, expected waste reduction, and yield improvement potential for your specific crops and soil conditions.
What software do I need to process multispectral drone data into usable field maps?
Agricultural drone data processing software transforms raw multispectral imagery into georeferenced orthomosaics, NDVI maps, and vegetation indices. Common tools handle radiometric calibration (correcting for atmospheric and sensor variations), georeferencing (aligning imagery to field coordinates), and sensor fusion (combining multiple spectral bands). Output includes field variability maps, plant counting analysis, biomass estimation, and canopy cover assessment. Many software platforms integrate directly with variable rate application systems. Choose software that matches your drone's sensor specifications and your agronomic goals.
This article was written using GrandRanker