 how-to
How Drones Help With Variable Rate Application
Table of Contents
- What You'll Need Before You Start
- Step 1: Map Your Field With Multispectral Drone Mapping for Agriculture
- Step 2: Turn Imagery Into Prescription Maps
- Step 3: Apply Inputs With Drone-Based Nitrogen Application
- The Benefits of Variable Rate Application for Your Bottom Line
- Hardware, Software, and Compliance Checklist
- Step 4: Read Your Post-Application Data
- Common Mistakes That Wreck Variable Rate Application Results
- Frequently Asked Questions
Last Updated: September 11, 2026
What You'll Need Before You Start
Variable rate application is the practice of matching fertilizer, seed, or spray rates to the exact conditions of each zone in a field rather than spreading one flat rate across every acre. Drones make that possible at a resolution ground rigs and satellite imagery cannot match. This guide from Gods Eye Drone walks through the full workflow, from flight planning to post-application analysis.
Before your first flight, line up five things:
- A drone rated for the payload and flight time your acreage demands
- A multispectral or RGB sensor with calibrated reflectance
- Prescription mapping software that exports to your spreader or sprayer controller
- Soil sampling data or historical yield maps to anchor the zones
- A certified remote pilot and, where required, a licensed applicator
Skip any one of these and the prescription is guesswork with extra steps. The FAA's Part 107 small unmanned aircraft rule governs the pilot side; state pesticide law governs the application side.
Step 1: Map Your Field With Multispectral Drone Mapping for Agriculture
Multispectral drone mapping for agriculture captures light outside the visible spectrum to reveal crop stress before the eye can see it. A near-infrared band, combined with red and red-edge bands, produces an NDVI or NDRE layer that shows which zones are thriving and which are starving.
Fly at a consistent altitude with 70-80% overlap. Inconsistent altitude wrecks reflectance calibration and makes zone boundaries meaningless.
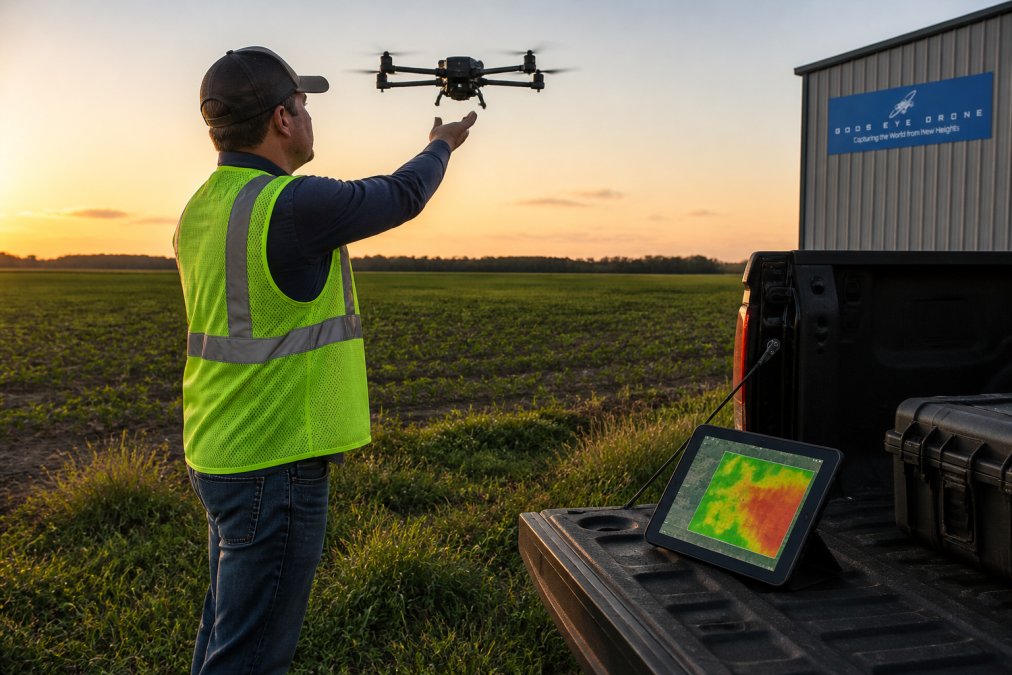
Sensors That Decide Your Mapping Accuracy
Sensor choice sets your ceiling. RGB cameras give you a visual record but no stress index. Multispectral sensors add the bands you need for vegetation indices. Thermal sensors flag irrigation problems and disease hotspots that spectral data misses.
Match sensor resolution to your smallest management zone. If you cannot resolve a zone, you cannot treat it differently.
Step 2: Turn Imagery Into Prescription Maps
A prescription map converts vegetation indices and soil data into a rate for every point in the field. The software overlays your NDVI layer, soil sampling results, and yield history, then assigns a target rate to each zone.
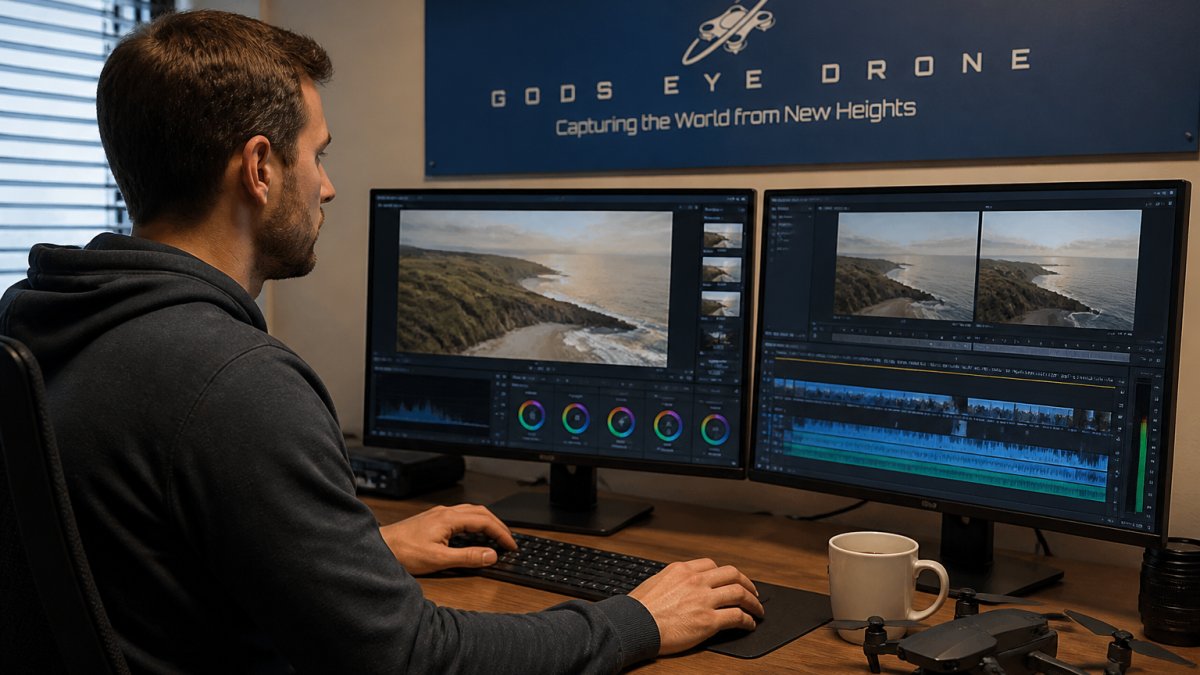
Stitching software processes the raw images into an orthomosaic. From there, you classify zones and set rates. Most platforms export in the ISOXML or shapefile formats your controller reads.
The USDA's precision agriculture resources outline how site-specific management reduces nutrient runoff while holding yields steady. That is the whole point of the exercise.
Step 3: Apply Inputs With Drone-Based Nitrogen Application
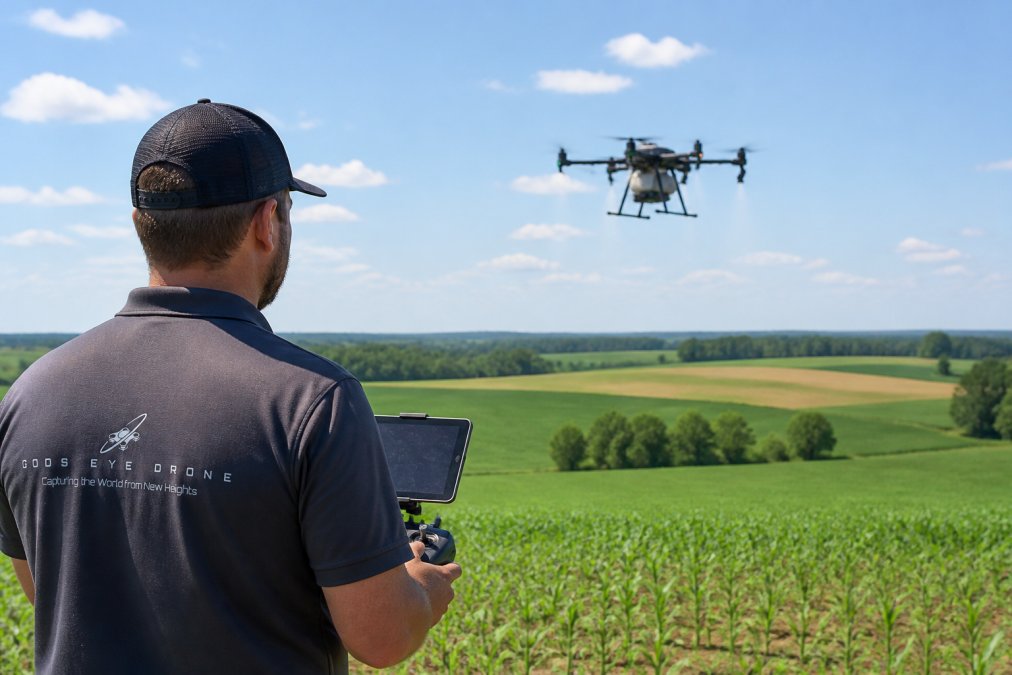
Drone-based nitrogen application delivers liquid product through nozzles or a spreader, following the prescription map at low altitude. The aircraft adjusts flow rate in real time as it crosses zone boundaries.
This is where the workflow either pays off or falls apart. Two forces decide the outcome.
Downwash Flow Field and Spray Drift
The downwash flow field is the column of air pushed down by the rotors. It drives droplets into the canopy, which improves coverage on the target and reduces drift. Get the altitude wrong and the downwash either scatters product or fails to penetrate.
Spray drift remains the biggest liability. Wind speed, droplet size, and boom height all move the needle. Fly when wind is under 10 mph, use coarse droplets, and keep the flight path tight to the field edge.
The Benefits of Variable Rate Application for Your Bottom Line
Every competitor says VRA "cuts input costs and reduces runoff." None of them show you the math. That is the gap this section fills: a working framework for deciding whether a drone-based VRA program pays for itself on your operation.
The Break-Even Formula
The core question is simple. How many acres of variable-rate treatment does it take before the savings on reduced product outweigh the cost of flying, mapping, and applying?
A practical formula most agronomists use:
Break-even acres = Annual VRA program cost ÷ (Flat-rate input cost per acre − VRA input cost per acre)
Where annual VRA program cost includes:
- Mapping flights (multispectral missions across the growing season)
- Prescription development and software subscription
- Application flights or a custom applicator's per-acre rate
- Your time, or a consultant's, for zone review and follow-up analysis
And the savings side comes from the difference between what you would have spread flat and what the prescription actually calls for. On a field with real variability, the prescription typically trims product on the low-response zones and holds or increases it on the high-response zones. The net reduction is what funds the program.
A Worked Example
Suppose a 500-acre corn field. A flat-rate program calls for a single nitrogen rate across every acre. A VRA prescription built from multispectral imagery and soil sampling splits that field into management zones and trims the rate on the weaker zones.
If the prescription reduces total product applied by even a modest margin, the per-acre savings multiply across 500 acres. Compare that annual savings figure against the annual program cost. If savings exceed cost, the program pays. If they do not, either the field is too uniform to benefit, or the zones are not tight enough to matter.
Most practitioners find the break-even point lands somewhere between a few hundred and a couple thousand acres, depending on crop value, input prices, and how variable the ground actually is. Uniform fields rarely justify the program. Highly variable fields usually do.
The Non-Financial Benefits
The bottom line is not the only line. Three others matter:
- Regulatory defensibility. As-applied maps and flight logs document exactly what went where. That record is worth real money when a nutrient management plan is audited or a runoff complaint lands.
- Agronomic learning. Every VRA season produces zone-level response data. Over three or four seasons, you learn which zones respond to nitrogen and which are limited by something else, compaction, drainage, pH. That knowledge compounds.
- Environmental compliance. Site-specific application keeps nutrients out of tile lines and waterways. The USDA's precision agriculture resources treat this as a core conservation practice, not a side benefit.
When VRA Does Not Pay
Be honest about the failure cases. VRA does not pay when:
- The field is agronomically uniform and the prescription collapses to a flat rate anyway
- Soil sampling is stale, so the zones are wrong and the savings are imaginary
- The crop's limiting factor is not the input you are varying
- Acreage is too small to amortize the mapping and software cost
A drone makes the application precise. It does not make a bad prescription good. The benefits table below summarizes where the money actually comes from.
| Benefit Driver | Mechanism | Where the Money Shows Up |
|---|---|---|
| Reduced product on low-response zones | Variable rate by management zone | Lower input invoice per acre |
| Earlier intervention on stress | Multispectral NDVI/NDRE detection | Preserved yield on stressed zones |
| Reduced off-target loss | Targeted application with downwash control | Lower drift liability and runoff risk |
| Documented compliance | Flight logs and as-applied maps | Cleaner audits, fewer penalties |
| Compounding agronomic data | Multi-season zone response tracking | Better prescriptions each year |
Run the formula on your own numbers before you commit. The framework is the benefit, the table is just the summary.
Hardware, Software, and Compliance Checklist
Compatibility is where most operators get burned. A prescription map is useless if your controller cannot read the file format, and a drone is useless if its payload cannot cover your acreage in one battery cycle. This section maps the hardware-to-software chain and the regulatory chain side by side, because both have to close before the first tank.
The Hardware-Software Compatibility Chain
A VRA workflow has four links. Break any one and the prescription never reaches the ground.
- Sensor → stitching software. Multispectral sensors output raw band data plus a reflectance calibration file. The stitching platform has to accept that sensor's format and apply the calibration. If it does not, your NDVI layer is uncalibrated and the zones are noise.
- Stitching software → prescription platform. The orthomosaic and index layers feed a prescription tool that overlays soil data and yield history. Most platforms export in ISOXML or shapefile, the two formats field controllers read most reliably. Confirm your export format before you build the map, not after.
- Prescription platform → controller. The controller in your spreader or sprayer reads the prescription and adjusts rate by GPS position. If the controller only reads one format, your software must export that one. This is the single most common failure point.
- Controller → application hardware. The controller drives nozzles or a spreader. Flow rate, droplet size, and boom or spreader width all have to be within the hardware's adjustable range. A prescription that calls for a rate your pump cannot deliver is a prescription you cannot fly.
What to Verify Before You Buy
- Sensor outputs a calibrated reflectance product, not just raw JPEGs
- Stitching software accepts your sensor's band set and calibration file
- Prescription platform exports ISOXML or shapefile (confirm which your controller reads)
- Controller firmware is current and supports variable rate
- Drone payload capacity covers your largest field in one battery cycle
- Battery flight time covers acreage per tank, with margin for wind
- Sensor calibration verified before every flight
- As-applied maps stored for recordkeeping and audit
Payload, Flight Time, and Acreage Math
The two numbers that decide whether a drone fits your operation are payload capacity and flight time. Payload sets how much product you carry per tank. Flight time sets how many acres you can cover per battery cycle. Multiply them and you get acres per cycle, then divide your largest field by that figure to see how many refill-and-recharge stops a single field demands.
A drone that covers your field in one cycle is a different economic proposition than one that needs six stops. Run the math on your own acreage before you commit.
FAA Part 107 and Applicator Requirements
Part 107 certification is required to fly commercially. That covers the pilot. It does not cover the application.
Applying pesticides by drone falls under the federal pesticide law and the state law where you operate. Many states require a licensed applicator or a certified operator working under one. Some states add drone-specific aerial application rules on top. The FAA's Part 107 small unmanned aircraft rule governs the pilot side; your state department of agriculture governs the application side.
Check both before you spray. The requirements are not uniform across states, and they change.
Recordkeeping That Survives an Audit
Keep four records per application:
- Flight log with date, time, location, and pilot
- As-applied map showing actual rate by position
- Product label and application rate used
- Weather conditions at application (wind speed and direction, temperature)
These four records are what an auditor, an insurer, or a nutrient management planner will ask for. Store them digitally and back them up. Paper logs in a truck cab do not survive a season.
Step 4: Read Your Post-Application Data
Post-application analysis closes the loop. Compare your as-applied map against a follow-up NDVI flight two to three weeks later. Zones that responded show a measurable index jump; zones that did not tell you the rate was wrong or the problem was not nutrient-related.
Track three numbers per field: product used versus prescribed, index change per zone, and yield at harvest. Over a few seasons, those numbers tell you which zones respond and which should be retired from variable treatment.
Common Mistakes That Wreck Variable Rate Application Results
The most common failure is treating the prescription as final. A map built on stale soil data sends the wrong rate to the wrong zone, and the drone applies it perfectly.
Other repeat offenders:
- Flying at inconsistent altitude, which breaks reflectance calibration
- Ignoring wind and applying during drift-prone conditions
- Using RGB-only imagery and calling it stress detection
- Skipping the follow-up flight, so you never learn what worked
Our certified pilots can handle mapping and analysis so your prescription rests on current, calibrated data rather than last season's guess. We fly multispectral missions and can deliver field maps your controller can actually use.
Frequently Asked Questions
How do drones collect data for variable rate application?
Drones fly a programmed grid over the field and capture images with multispectral or RGB sensors. Each image is tagged with GPS coordinates, then stitched into an orthomosaic that shows crop vigor differences across the field. That geospatial data feeds into software that builds prescription maps, which tell spreaders or sprayers how much product to apply in each zone. Soil sampling results are layered on top to confirm what the imagery suggests about nutrient needs.
What sensors are required for drone-based variable rate mapping?
Most agronomic mapping uses a multispectral sensor that captures red, green, blue, red-edge, and near-infrared bands. The red-edge and NIR bands are what let you calculate vegetation indices like NDVI, which correlate with crop health and nitrogen status. RGB cameras work for basic field scouting but cannot separate nutrient stress from other issues as reliably. Thermal sensors add value for irrigation analysis, and LiDAR helps with elevation and drainage modeling.
Can drones perform variable rate spraying directly?
Yes. Agricultural spray drones carry 10 to 40 gallons of liquid and use prescription maps to vary output across the field in real time. They work well on small, irregular, or waterlogged fields where ground rigs struggle, and they avoid compaction. Current FAA rules limit operations to visual line of sight and specific payload weights, so check Part 107 waivers and any Section 44807 exemptions before flying. Drone-based nitrogen application is the most common use case.
How does variable rate application reduce fertilizer waste?
A uniform pass puts the same rate on every acre, so low-yield zones get more nitrogen than the crop can use and high-yield zones get too little. Variable rate application matches the rate to each zone using prescription maps built from drone imagery and soil data. That cuts over-application in poor zones, which also reduces nutrient runoff into waterways. Most growers see input savings that offset the cost of mapping within one or two seasons.
Variable rate application rewards operators who treat it as a data loop, not a one-time flight. The fields that improve are the ones where mapping, application, and follow-up analysis stay connected season after season. Gods Eye Drone brings certified pilots, multispectral sensors, and post-flight analysis to every mission, so your inputs land where they pay off. Get started with Gods Eye Drone and turn your field data into prescriptions you can trust.